

What if we flip a biased coin, with the probability of a head p and the probability of a tail q = 1 - p? The probability of a given sequence, e.g., 100010 ..., in which k heads appear in n flips is, by Eq. A.4, pqqqpq ..., or
There are a total of 2n possible sequences. Only some of
these give k heads and n - k tails. Their number is
where 0!, whenever it appears in the denominator, is
understood to be 1.
Since any one or another of these sequences will do, the
probability that exactly k heads occur in n flips is, by Eq.
A.2.
This is the binomial distribution. The coefficient
We can use the binomial theorem to show that the
binomial distribution is normalized:
As an example, let's work out the case of 4 flips of an
unbiased coin. If p = q = 1/2, then
pkqn-k = (1/2)n
= (1/2)4 = 1/16 for all values of k, and the probabilities
P(0;4,1/2), ..., P(4;4,1/2) are equal to the binomial
coefficients
and
we obtain the probabilities 1/16, 1/4, 3/8, 1/4, and 1/16,
as before.
The expectation value of k is
To evaluate this, note that the k = 0 term is 0 and that
k/k! = 1/(k - 1)!, so that
Next, factor out np:
Finally, change variables by substituting m = k - 1 and
s = n - 1:
The sum in this expression is the same as the one in
Eq. A.20; only the labels have been changed. Thus,
One can evaluate the expectation value of k2 in a similar
fashion by two successive changes in variables and show
that
The variance of k, Eq. A.14, is
and its standard deviation is
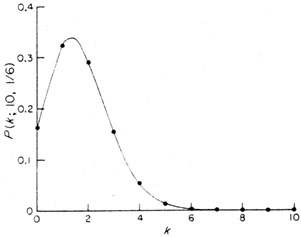
An example of the binomial distribution is given
in Fig. A.4, which shows the theoretical distribution
P(k;10,1/6). This is the probability of obtaining a given
side k times in 10 throws of a die.
Figure A.4. The binomial distribution for
n = 10, p = 1/6. The mean
value is 1.67, the standard deviation 1.18.


 is the
binomial coefficient, the number of combinations of n
things taken k and n - k at a time. You have seen it
before in algebra in the binomial theorem:


 , ... ,
 times this factor. Since


