


3.2. More Data!
A step further in the understanding of the mass and structure of Coma was done
by Mayall [91],
thanks to the new technology of electronic photography.
In Fig.3 of his paper
~ 50 galaxy velocities are plotted vs. clustercentric distance, d, and
the decrease of
 v with d is
already quite evident.
Despite this significant progress, Mayall complained that:
v with d is
already quite evident.
Despite this significant progress, Mayall complained that:
...it is doubtful that satisfactory answers will be obtained until there are at least a hundred velocities available for discussion, and several hundred would be much better. If this is the case, then the current rate of less than 10 velocities per year is impracticably slow.
It is ironic that the actual average rate since the 60's has been only twice as high (5) as the "impracticably low" rate in Mayall's times!
The first numerical simulation of the evolution of
a Coma-like cluster (Peebles
[106])
showed that the
3D-v
should decrease with
increasing clustercentric distance. Nearly simultaneously, the decrease of
projected-v was
actually measured by Rood
[113] in Coma.
He pointed out that such a radial trend of
v could be due to a
real dependence
of the 3D-v with
radius, or to an anisotropic distribution of galaxy
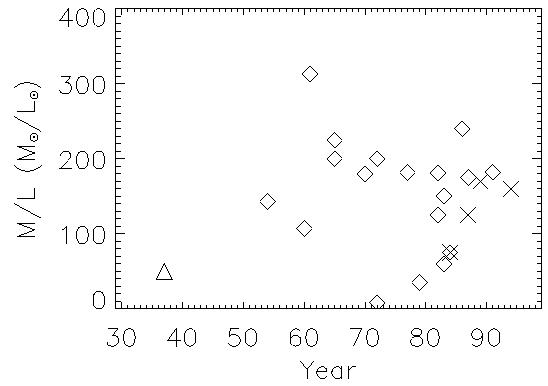
orbits. In the early 70's Coma M/L estimates were already quite close
to current estimates (see Fig. 3).
|
Figure 3. Several estimates of Coma M/L vs. the year when they were derived. Diamonds represent estimates based on optical data, X's represent estimates based on X-ray data; a triangle represent Zwicky's original lower limit estimate. |
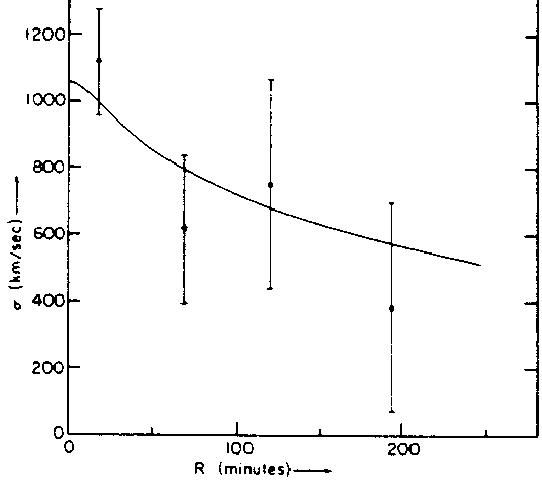
The density profile, accurately determined by Omer et al.
[104] and
Rood et al. [115],
in combination with the
v-profile (see
Fig. 4), was used by Rood et al. to derive Coma's M/L,
and constrain the orbital anisotropy of Coma galaxies. They came to the
conclusion that the density and velocity dispersion profiles are
"consistent with an isotropic velocity distribution".
Ivan King [81],
the last author in Rood et al.'s paper, relaxed
this conclusion. He noted that, in fact, several distributions
of the galaxies and the dark matter were consistent with the data,
and current cluster mass estimates could be systematically in error
by a factor three. Ten years after, Kent & Gunn and Bailey
[13]
arrived at (rouhgly) the same conclusions of Rood et al. and,
respectively, King!
|
Figure 4. The radial velocity dispersion profile of Coma, km/s vs. arcminutes - from Rood et al. |
In the following years, mainly through the observations of Gregory & Tifft [60], [61], [62], [138], the total number of measured redshifts for Coma galaxies increased to over 200.
5 The total number of currently available
velocities for Coma cluster galaxies is
 800 (see van Haarlem's
contribution in these proceedings), i.e. 750 new velocities in the last
37 years.
Back.
800 (see van Haarlem's
contribution in these proceedings), i.e. 750 new velocities in the last
37 years.
Back.