


2.2. Surveys and catalogues
After the Second World War, the Lick and Palomar sky surveys and the spectroscopic observations of Humason, Mayall & Sandage [238] provided the essential data-base for the analysis of the distribution of galaxies. The 1956 paper of Humason et al. [238] collected the results of twenty years of spectroscopic observations, providing more than 800 redshifts of galaxies, of which 75 in Virgo, 23 in Coma, and a few dozens in several other clusters. They noted that there was ``increasing evidence'' for a general clustering phenomenon, and dismissed Hubble's view of a uniform galaxy distribution with a few sporadic isolated clusters.
|
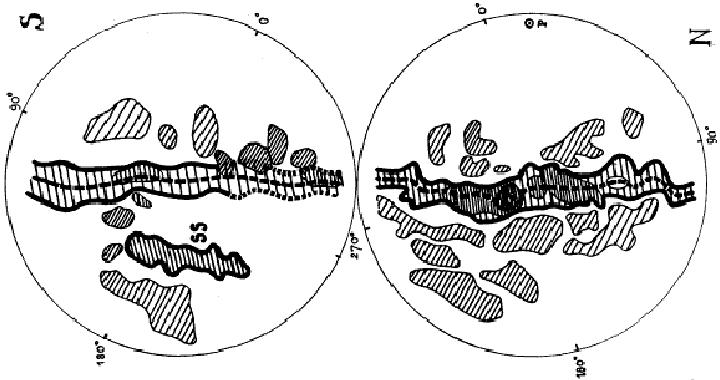
Figure 3. Clustering of the nebulæ in the southern and northern emisphere giving evidence of the Local Supercluster. The density of the shading gives in a qualitative way an idea of the nebular density - from de Vaucouleurs (1953). |
The evidence for the ``Local Supergalaxy'' and for many other superclusters grew stronger mainly through the works of de Vaucouleurs [128, 129] - see Fig. 3 - Shane & Wirtanen [412], van den Bergh [475], and Abell [11]. Only Zwicky [520] continued to deny the existence of superclusters. Zwicky [524] thought that the apparent non-uniform distribution of clusters was due to the obscuration effects of inter-galactic and IC dust. He eventually discovered a supercluster himself [526] (no.20 in Zucca et al. [510]'s catalogue), but refused to call it a supercluster. Zwicky's point of view was however very different from Hubble's. Zwicky thought galaxy clusters to be much larger than usually accepted, almost reaching to the sizes of superclusters. Clusters, he wrote in 1952, ``fill the universe just as the bubbles fill a volume of suds''. For these reasons, Abell [14] thought that Zwicky's opposition to the idea of superclusters was purely semantic.
In a series of papers, Neyman, Scott, Shane & Swanson [320, 321, 322, 408] addressed the issue of galaxy clustering by applying mathematical models to the Lick galaxy counts of Shane & Wirtanen [412], and were the first to compare the observed galaxy distribution to synthetic images of the Universe [408].
The introduction of new techniques and new ideas pushed the search for
clusters to higher redshifts. Baum
[53]
pointed out that
clusters at redshifts ~ 0.5 could be most easily detected by
moving redwards the observing waveband. Minkowski
[307]
speculated that collisions between galaxies could produce
radio-emission; since collisions should be frequent in dense
environments, he suggested that clusters could be found around
radio-galaxies. In 1960 he applied this idea to the region around
3C295, and found a system of galaxies at a redshift
 0.44-0.46. 3C295 held the
record of the highest redshift cluster
for a long time (4).
0.44-0.46. 3C295 held the
record of the highest redshift cluster
for a long time (4).
Meanwhile, the search for nearby galaxy clusters had become systematic. The time of serendipitous discoveries was long gone, and in 1957 Herzog, Wild & Zwicky [216] announced the construction of a Catalogue of Galaxies and Clusters of Galaxies [527], that upon completion would contain ~ 10000 clusters. Their announcement came just one year before the publication of Abell's catalogue [7], but the final CGCG was to be published only in 1967.
Abell's paper, The distribution of rich clusters of galaxies, is a milestone in the history of science with galaxy clusters (5). The very fact that Abell cluster has become a synonymous with rich cluster tells us a lot about the importance of this paper.
Abell's 2712 clusters were selected on red POSS plates because he realized the advantage of the red band over the blue band for the identification of distant clusters. Abell's radius was subjectively chosen by looking at the projected overdensities of clusters, and yet is close to the cluster gravitational radius [73]. Abell's subjective selection criteria were extremely well chosen, and even the background subtraction was quite accurate.
Abell's paper was much more than a catalogue of clusters. He was the first to show that the distribution of cluster richnesses - which is broadly related to the mass distribution - is very steep. He knew that his cluster sample was incomplete at the low richness end, and for this reason he defined a statistical subsample of the richest 1682 clusters. As a matter of fact, he wrote
``during the course of the plate inspections, many thousands of clusters and groups of galaxies were recognized which were not catalogued because they obviously were not sufficiently rich to insure their essentially complete identification. Thus neither the statistical sample of clusters nor a subjective impression indicates a maximum in the N(n) versus n relation.''
We better remember this statement when commenting upon the results of modern optical cluster surveys [286, 362] (see also LOBO, these proceedings).
The publication of Abell's catalogue opened a new era in the investigation of galaxy clusters. All of a sudden, researchers had a catalogue of clusters, and they could start look at them as a population, rather than as individual objects. The first volume of Zwicky et al. [527]'s Catalogue of Galaxies and Clusters of Galaxies was published only a few years later, but it did not exert such a large influence on the study of clusters. The main problem with the CGCG, as immediately pointed out by Abell [12], was that the sizes of Zwicky's clusters were distance-dependent, since they were defined within the isopleth contour that represents twice the field density. The CGCG could then not be used as a statistical homogeneous cluster catalogue, and most researchers preferred to base their analysis on Abell's catalogue (and they still do).
The first critical examination of Abell's and Zwicky's catalogues was done by Reaves [370]. Abell's statistical subsample was shown to be ~ 85 % complete, while the completeness of the full Abell catalogue is only ~ 40 %, similar to that of the Zwicky catalogue. Reaves' estimates were based on how frequently a given cluster detected on one plate was missing on another plate where it should have been seen. His conclusions are quite close to those obtained by Lucey [284] and Briel & Henry [79] several years after.
In the following years, there was an increase and an improvement in the classification of clusters, along these five main research lines:
In 1973, Karachentseva [249] published a Catalogue of isolated galaxies. Clustered galaxies have become the rule, isolated galaxies the exception, to such a point that two years later de Vaucouleurs could ask: ``Are there isolated galaxies?''
|
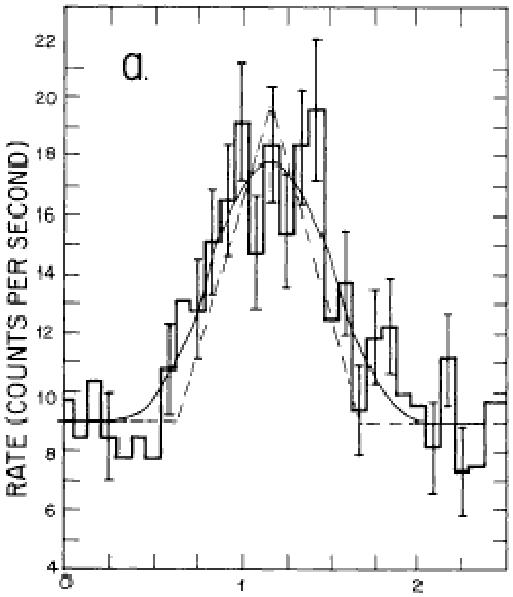
Figure 4. Counting rates per degrees (relative azimuth on x-axis) in the Coma cluster. The solid line indicates a fit with an extended source, the dashed line the expected response to a point source. From Gursky et al. (1971). |
In 1971 Meekins et al. [299] and Gursky et al. [201] detected extended X-ray emission from the Coma cluster (see Fig. 4). Little by little, optical catalogues of galaxy clusters would give way to X-ray catalogues. Initially there were just lists of optical counterparts for a few X-ray sources (e.g. Melnick & Quintana [301]), but soon after extensive X-ray surveys of hundreds of Abell clusters were published (see, e.g., Ulmer et al. [470]).
4 3C295 later became one of the two clusters
where Butcher & Oemler
[85]
found evidence for an increased
fraction of blue galaxies.
Back.
5 bell's paper was just ``a portion
of a thesis
submitted in partial fulfillment of the requirements for the
Ph.D. degree'' - though requirements, no doubt!
Back.