


2.4. Clusters and the Large Scale Structure of the Universe
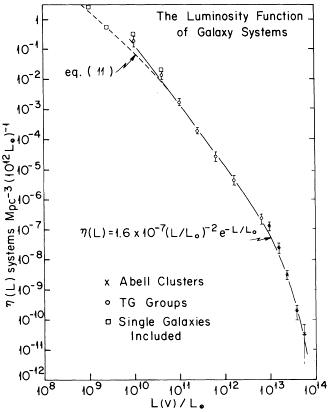
The huge observational effort of the seventies made it possible to evaluate the distribution functions of cluster properties. At the end of the 70's Chincarini [105] established the relation between cluster luminosities and their richness classes. One year later, based on similar relations, Neta Bahcall [43, 44] produced the first optical - see Fig. 6 - and X-ray luminosity functions of galaxy systems, ranging six decades in luminosity. Subsequent studies, based on larger data-sets, confirmed the validity of Bahcall's determinations (see, e.g., McKee et al. [298], Hintzen et al. [219] and Abramopoulous & Ku [21]). A preliminary attempt to produce the virial mass function of clusters was done by Struble & Bludman [438], but their sample was incomplete and biased at the low-mass end. The first unbiased estimates of the cluster mass function [46, 70] would only come in 1993, 14 years later.
|
Figure 6. The luminosity function of all galaxy systems. The solid line represents the best fitting curve. From Bahcall (1979a). |
In 1982 Davis et al. [122] produced the first wide-angle galaxy redshift survey, not dominated by the Local Supercluster. The authors hoped that their survey ``would begin to approximate a fair sample volume of the universe''. Maybe the first CfA survey was no so ``fair'' after all, but Davis et al. [122]'s description of the galaxy distribution was fairly correct. The galaxy distribution, they wrote, ``is frothy, characterized by large filamentary superclusters of up to 45 Mpc in extent, and corresponding large holes devoid of galaxies''.
A major output of the first CfA survey was Huchra & Geller [235]'s catalogue of groups of galaxies. For the first time, groups were identified in 3-dimensions, as volume-density enhancements in the distribution of galaxies. Of the 176 catalogued groups, 74 were identified for the first time [174]. In those years, another famous catalogue of groups was created, Hickson [217]'s catalogue of 100 compact groups.
|
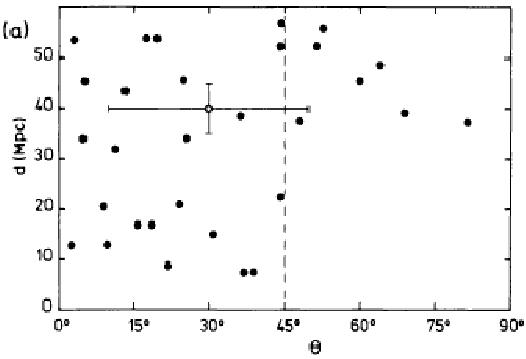
Figure 7. The difference between the cluster position angle and the position angle defined by the direction to the closest neighbouring cluster (x-axis), vs. the spatial distance to the closest neighbour (y-axis). From Binggeli (1982). |
Meanwhile, astronomers started to use galaxy clusters as tracers of
the Large Scale Structure of the Universe. Binggeli
[62]
showed the existence of cluster alignments on scales up to 45 Mpc
- see Fig. 7. The
cluster correlation function was computed by Bahcall &
Soneira [50]
and Klypin & Kopylov
[260],
and shown to
extend to 200 Mpc. Other useful tracers of the Large Scale Structure
were found to be voids (Sharp
[420])
and Lyman- absorbers, which Oort
[336]
used for the first time to shed
light on the clustering at very high redshift (z > 2).
absorbers, which Oort
[336]
used for the first time to shed
light on the clustering at very high redshift (z > 2).
In 1983 Abell [17] revised the properties of superclusters and suggested that they constitute the end of the clustering hierarchy, since their separations are comparable to their sizes, so that superclusters are interconnected. Shortly before his death, occurred on October 7th 1983, Abell [18] (together with Corwin) announced the preparation of the southern extension of his catalogue, a work that would keep busy his collaborators for six more years [19]. Abell's original catalogue was however to remain unsurpassed for the quality of the cluster richness estimates (see Girardi et al. [182]).