

3.5.1. Hierarchical Clustering Patterns
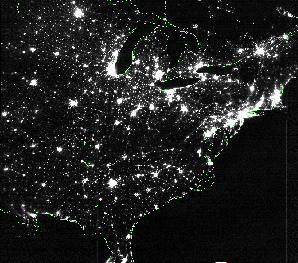
The complexity in the galaxy distribution which has been revealed by these data can be qualitatively described using a more familiar analog. The distribution of population density in the United States is an excellent example of hierarchical clustering. There are large metropolitan complexes (superclusters) in which there are multiple condensations (individual large cities). Between the metropolitan areas are small towns or groups of towns and, in the case of the west coast, large voids. Figure 3-10 provides a convenient observational characterization of this structure. As lights are a good tracer of people, then the density of light(s) is a good indicator of the population density. There are several questions that one can then ask about this distribution of population density that are similar to the questions asked about the galaxy distribution.

|
Figure 3-10: An example of hierarchical clustering in the distribution of lights seen in this image of the East Coast of the US taken at night. Image courtesy of NOAA. |
 Is there a preferred scale
to the clustering?
 Is there a characteristic
spacing between regions of large population density?
 How big of region
constitutes a fair sampling of the population distribution?
 What is the scale size over
which the population density is homogeneous?
This last question is most relevant and its equivalent to the following: What is the radius of a circle such that no matter where one positioned that circle in the US, it would contain the same number of people? The answer, of course, is that such a circle does not exist because the population is so highly clustered. Thus, within the sample offered by the size of the US, there is no region which is homogeneous. The parallel with the Universe should be clear. We know that on a large scale the Universe is homogeneous because that is what we observe in the CMB. The most startling nature of redshift surveys is that, as larger volumes are probed, larger structures are seen. We do not yet have a strong indication that we have sampled a large enough volume to be considered a "fair" volume and the homogeneity scale of the galaxy distribution seems to increase with sample depth. At some scale size, an inhomogeneous galaxy distribution (and by inference only, an inhomogeneous mass distribution) is inconsistent with the nature of the CMB. There are some indications that such an inconsistency has now been observed and if so, this is a major challenge to understanding how such large scale structure could have arisen (see Chapters 4 and 5).
Redshift surveys are aimed at measuring structure in the galaxy distribution. There are two basic approaches one could adopt in revealing this structure. These two approaches are known as either Pencil Beam surveys or Slice surveys. Again, we can return to the US population density analogy. In the Pencil Beam case we pick some small region of space and measure the redshifts of all galaxies in that region, down to some limit in apparent flux. This would be comparable to thoroughly measuring the population density of a small area in the US. If that small area were in New York, the survey would return quite a different result than if the area were in Nevada. The analogy to the Slice case would be to pick a narrow latitude range and survey everything along that latitude from the west to the east coast. A plot of population density vs. longitude would then give a representation of the distribution of high and low density regions and their connectedness. Unfortunately, this topology will be dependent on the chosen latitude as its possible to choose a latitude strip which intersects no large cities.
For a highly clustered distribution it is not clear which sampling strategy is optimum for characterizing the galaxy distribution. In both cases one has to worry about not intersecting the structure. In the case where the size of a "fair" volume is relatively small, then the Slice approach to sampling is the best provided that the width of the slice exceeds the local correlation scale of individual galaxies. In this case, a Slice strategy will probe the various clustering scales that are present. In the case where the size of the "fair" volume is large, a few pencil beams are probably the best way to identify the scale size of the largest structures. However, these pencil beams will provide very little information on small and intermediate scales. Moreover, since only sparse sampling is done along the pencil beam, small scale clustering effects can give rise to an apparently large clustering signal. That is, at some redshift, the size of the pencil beam will project to the same linear dimension as galaxy-galaxy correlation length scale. In that case, two galaxies at that redshift will be detected instead of one. This can give the illusion of a large overdensity of galaxies at that redshift when in fact the enhancement is due to the small-scale clustering nature of galaxies. The Slice approach does not suffer from this bias and hence is probably the better way to characterize the local topology. In what follows, we will described the results of both approaches as each has provided very intriguing data about the three-dimensional galaxy distribution.