Despite the complications discussed in the previous section, dust reddening
at UV and optical wavelengths can be "treated", at least in galaxies and
galaxy regions where massive stars dominate the radiation output
[8,
23,
24,
9,
7].
This includes a wide range of extragalactic objects, from the centrally
concentrated starbursts in spirals to the Blue Compact Dwarfs. In
regions of SF, the
massive star population responsible for the nebular line emission is also
responsible for most of the UV radiation. The spectral shape of the UV emission
(> 1200 Å) is relatively constant over a relatively large range of
ages, because
we are observing the Rayleigh-Jeans part of the massive stars' spectrum; the
non-ionizing photons which make the UV spectrum are less age-sensitive than
the ionizing photons (i.e., nebular line emission); the latter disappear before
appreciable changes in the UV spectral shape can be observed. If the UV
spectrum is fit as F( )
)

 , the UV index
has values between -2.5 and
-2 for a reddening-free, ionizing star population
[22].
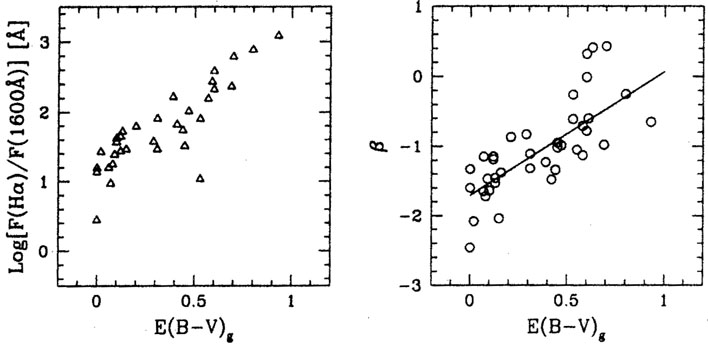
The relation between
UV stellar continuum and ionized gas emission has proven crucial for pinning
down the selective effects of dust obscuration in star-forming
galaxies. Various
diagnostics have been constructed from multiwavelength data
(Figure 1a
and 1b;
[8,
7]),
extending the relation between stellar continuum and nebular
emission from the UV to the K band.
, the UV index
has values between -2.5 and
-2 for a reddening-free, ionizing star population
[22].
The relation between
UV stellar continuum and ionized gas emission has proven crucial for pinning
down the selective effects of dust obscuration in star-forming
galaxies. Various
diagnostics have been constructed from multiwavelength data
(Figure 1a
and 1b;
[8,
7]),
extending the relation between stellar continuum and nebular
emission from the UV to the K band.
Adopting the standard notation:
with Fobs(
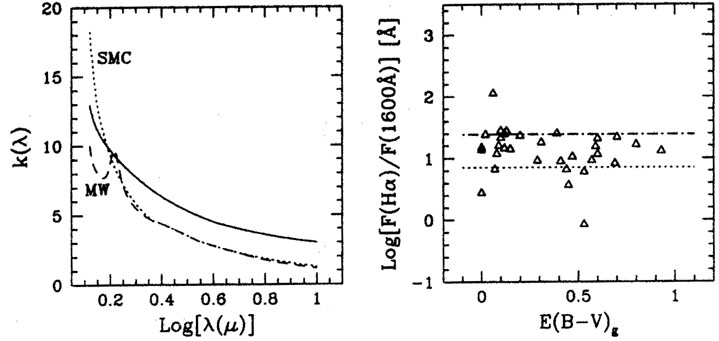
The selective attenuation is shown in Figure 2a
in comparison with two
extinction curves, the Milky Way and the SMC. The comparison is purely
illustrative and should not be taken at face value, because the dust
attenuation
of galaxies is conceptually different from the dust extinction of stars. The
latter measures strictly the dimming effect of the dust between the observer
and the star, while the former folds in one expression (equation 2) a variety
of effects: extinction, scattering, and the geometrical distribution of
the dust
relative to the emitters. One comparison is, however, licit: the 2175
Å bump,
which is a prominent feature of the Milky Way extinction curve, is absent
in the attenuation curve. Gordon et al. (1997, see also, this Conference)
have proven that the absence of the feature cannot be explained either with
scattering or dust geometry, and must be intrinsic to the extinction
curve of the ISM in the star-forming galaxies.
Expressions (1) and (2) can be used to derive the intrinsic spectral energy
distribution F0(
Here, the color excess of the ionized gas is derived from the Balmer decrement
(or any suitable set of atomic hydrogen emission lines) and the application
of a 'standard' extinction curve. The selective extinction of the Milky Way,
LMC or SMC curves has similar values at optical wavelengths
[15], so any
of these curves can be used for the ionized gas. In addition, a foreground
dust distribution appears to work well for the gas when moderate extinctions,
E(B - V)g
Regions of active SF may be inhospitable to dust; supernovae explosions
and massive star winds generate shock waves and, possibly, mass outflows
[20].
Shocks and outflows likely destroy or remove the dust from inside the
region; only the external (foreground) dust survives
[9],
accounting for the
observed gas reddening geometry. This simple interpretation does not account,
however, for Equation (3): stars are on average a factor 2 less reddened than
the ionized gas
[14,
8].
The factor 2 difference in reddening implies that the
covering factor of the dust is larger for the gas than for the stars
[7].
Indeed,
while the nebular emission requires the presence of the ionizing stars, the
UV and optical stellar continuum is contributed also by non-ionizing stars.
Ionizing stars are short-lived and remain relatively close to their
(dusty) place
of birth during their entire lifetime, while the long-lived non-ionizing stars
have time to 'diffuse' into regions of lower dust density. If this is the case,
stars and gas will not occupy the same regions
[10],
and stellar continuum and
nebular emission should be largely uncorrelated. Why then does the reddening
of the stellar continuum correlate with the reddening of the ionized gas, as
implied by Figure 1? For both the correlation
and Equation (3) to be valid,
the aging and diffusion of the stars must be compensated by the production
of new massive stars. In other words, the SF event must have a finite duration
and cannot be instantaneous. A lower limit to the SF duration can be placed
by remembering that the crossing time of a region of ~ 500 pc is about 50 Myr
for a star with v = 10 km/s.
Whichever the interpretation, expressions (2) and (3) are purely empirical
results, and are independent of any assumption on the geometry of the dust
distribution and on the details of the dust extinction curve. They yield
probably
the most appropriate reddening corrections for the integrated light of
extended star-forming regions (or galaxies, see
Figure 2b).
 ) and
F0() the observed and
intrinsic fluxes, respectively, the selective
attenuation of the stellar continuum
k(), normalized to
k(B) - k(V) = 1,
can be expressed as:
) and
F0() the observed and
intrinsic fluxes, respectively, the selective
attenuation of the stellar continuum
k(), normalized to
k(B) - k(V) = 1,
can be expressed as:
 )
of the star-forming region, once the effective color excess
E(B - V)s of the stellar continuum is known. Because of the
geometrical information folded into the expression of
k(), E(B - V)s is
not a straightforward
measure of the total amount of dust between the observer and the source (as
in the case of individual stars). The relation between
E(B - V)s and the color
excess E(B - V)g of the ionized gas is:
)
of the star-forming region, once the effective color excess
E(B - V)s of the stellar continuum is known. Because of the
geometrical information folded into the expression of
k(), E(B - V)s is
not a straightforward
measure of the total amount of dust between the observer and the source (as
in the case of individual stars). The relation between
E(B - V)s and the color
excess E(B - V)g of the ionized gas is:
 0.1-1,
are present.
0.1-1,
are present.