


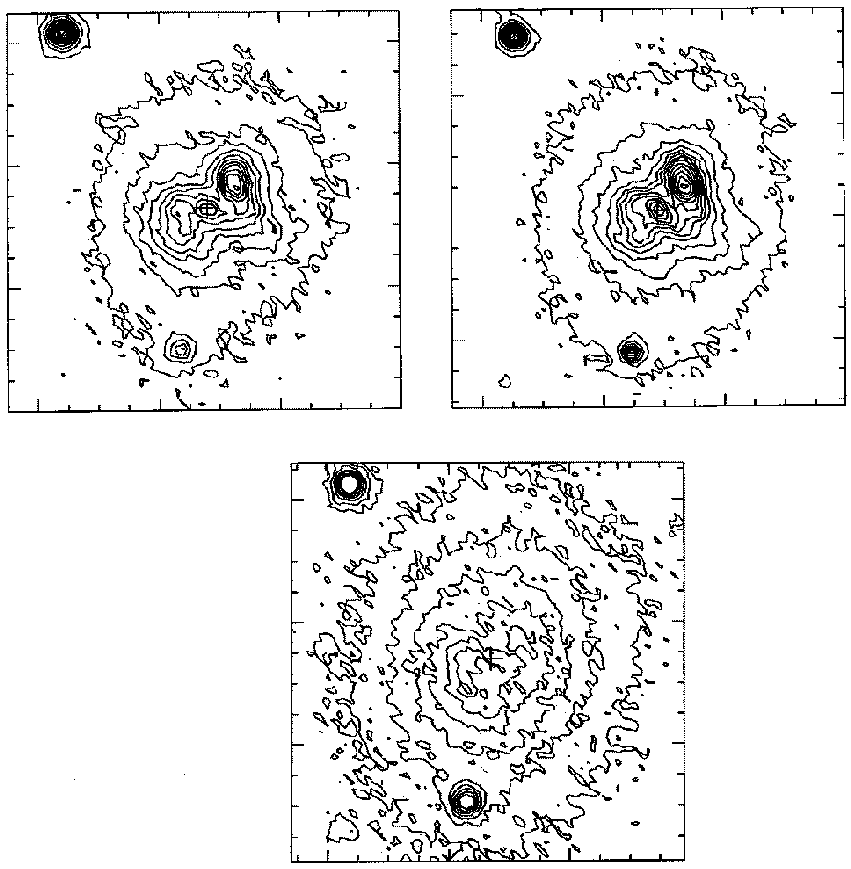
As discussed above, four components contribute to the optical radiation from the central regions of the Cygnus A galaxy. With central regions we mean here and in the following the central four by four arcseconds, as measured with respect to the central radio core, at RA(1950) 19:57:44.443, DEC(1950) +40:35:46.37. High resolution ground based optical images were recently obtained by Vestergaard and Barthel (1993), and Stockton et al. (1994). We reproduce in Fig. 12 three broadband images from the former authors, while dealing with the four contributing components: elliptical galaxy star light, narrow emission line gas, dust, and blue featureless continuum.
|
Figure 12. V-, R- and I-band images of the central 12.8 x 12.8 arcsec in the Cygnus A galaxy, displayed at the same scale and centered on the (marked) radio core position. The tick marks are separated by 1 arcsec. The contour levels are: 19.44, 19.55, 19.66, 19.77, 19.88, 19.99, 20.14, 20.32, 20.53, 20.80, 21.15 and 21.67 mag per square arcsec (V-band), 18.25, 18.39, 18.53, 18.67, 18.81, 18.95, 19.09, 19.23, 19.39, 19.61, 19.88, 20.24 and 20.79 mag per square arcsec (R-band), and 18.77, 18.91, 19.08, 19.27, 19.50, 19.81, and 20.22 mag per square arcsec (I-band). Reproduced from Vestergaard and Barthel (1993). |
The V-band image, at 0.77arcsec resolution, shows that the Cygnus A
nucleus is triple rather than double. The V-band is ~ 40%
contaminated with line emission (mostly [OIII]). It is seen that the
NW-cloud which is known to be bright in line emission
(Pierce and Stockton
1986)
is resolved. An optical emission component appears
coincident with the radio core component. There are strong gradients in
the emission, which could be due to emission line gas, dust, ionization,
or a combination of these. The intermediate level V-band morphology in
this image - as well as in
Thompson's (1984)
0.65arcsec resolution
image - is nevertheless strikingly biconical. The R-band image, at
0.58arcsec resolution, shows the nuclear triple morphology in finer
detail. The R-band is ~ 45% contaminated with line emission
(mostly H and [NII]). Both the
NW line cloud and the nuclear
component stand out, and both are clearly resolved. The central
component appears to be located on a ridge, in p.a. ~ 45°.
Strong gradients are again seen. In contrast, the 0.80arcsec resolution
I-band image, having at most 3% line contamination, is surprisingly
smooth. There is a mild gradient from NW to SE, which is due to excess
extinction NW, at the line cloud position. Patchy extinction may also
be present 1 arcsec SE of the radio core position. A deconvolved I-band
image at 0.42arcsec resolution
(Vestergaard and Barthel
1993)
shows two
main extinction features ("dust fingers"): one in between the core
component and the NW line cloud, entering from the north, and one just
SW of the core component, entering from the south. These two features
in combination are responsible for the faint continuum ridge at the
radio core position. We recall that the presence of internal extinction
in the central regions of the Cygnus A galaxy does not come as a
surprise, since it was already inferred from the spectrophotometry
(Osterbrock and Miller
1975,
Pierce and Stockton
1986).
Most of the
excess emission at the radio core position seen in V- and R-band
however, must be due to line emission. Increased reddening at this
nuclear component was measured
(Vestergaard and Barthel
1993).
and [NII]). Both the
NW line cloud and the nuclear
component stand out, and both are clearly resolved. The central
component appears to be located on a ridge, in p.a. ~ 45°.
Strong gradients are again seen. In contrast, the 0.80arcsec resolution
I-band image, having at most 3% line contamination, is surprisingly
smooth. There is a mild gradient from NW to SE, which is due to excess
extinction NW, at the line cloud position. Patchy extinction may also
be present 1 arcsec SE of the radio core position. A deconvolved I-band
image at 0.42arcsec resolution
(Vestergaard and Barthel
1993)
shows two
main extinction features ("dust fingers"): one in between the core
component and the NW line cloud, entering from the north, and one just
SW of the core component, entering from the south. These two features
in combination are responsible for the faint continuum ridge at the
radio core position. We recall that the presence of internal extinction
in the central regions of the Cygnus A galaxy does not come as a
surprise, since it was already inferred from the spectrophotometry
(Osterbrock and Miller
1975,
Pierce and Stockton
1986).
Most of the
excess emission at the radio core position seen in V- and R-band
however, must be due to line emission. Increased reddening at this
nuclear component was measured
(Vestergaard and Barthel
1993).
The HST blue continuum and [OII] images of the nuclear region of Cygnus A (Jackson et al. 1994 and Cabrera-Guerra et al. 1996) confirm the presence of the optical component at the radio core location. Moreover, this component was found to lie on a faint bar in p.a. ~ 45°, and to have at least a fifty-fifty line-continuum ratio. Another interesting finding was that the NW emission line line cloud appeared resolved into two separate line emitting components, with the radio jet passing through the gap in between. This gap is discussed in detail above.
Very recent ground based imaging in line and continuum radiation as well
as spectroscopy was presented by
Stockton et al. (1994).
The nature of
the featureless continuum was investigated using line-free images,
subtracting symmetric galaxy profiles. The resulting spectral energy
distribution is consistent with several mechanisms, but on the basis of
the continuum light spatial distribution
Stockton et al. (1994)
find a
starburst related origin the dominant one. Some level of scattered blue
continuum must however be present, given the optical polarization
measurements
(Tadhunter et al. 1990).
This issue will be dealt with in
more detail in the next section. Spatial distributions of low and high
ionization species were found to be different. In particular the
H+[NII] were found to stretch
outward N and S, in a
~ 10 arcsec planar structure perpendicular to the radio axis. Dust
appeared associated with these low-ionization extensions. The
high-ionization [OIII] does not show this N-S structure, but appears
concentrated in a double morphology along the radio axis, centered on
the radio core position. A deconvolved [OIII] image confirms the
presence of the gap in the NW cloud, as discovered on HST images as
discussed above. Line ratio diagnostics indicate that the
high-ionization species are almost certainly photo-ionized.
Surprisingly, a Balmer decrement inferred extinction map shows little
correlation with either the continuum or the emission line morphologies.
On the basis of the observed absorption due to the MgIb triplet
Stockton et al. (1994)
obtain a Cygnus A heliocentric redshift value z = 0.0562
± 0.00015. The velocity field was found to be complex, with clear
signs of counter-rotation, and high-velocity gas most likely associated
with the radio jets, on both sides of the galaxy nucleus. The presence
of such high-velocity gas had been noted earlier by
Tadhunter (1991).
Using high signal to noise long slit spectroscopy, Tadhunter et al. (1994) also address the nature of the extended emission line system. Balmer decrements, observed with slits along and perpendicular to the radio axis, indicate significantly increased reddening at the radio core location, i.e., a piling up of dust at that position. This is in agreement with Vestergaard and Barthel (1993) and Stockton et al. (1994). Tadhunter et al. (1994) also discovered ionization gradients perpendicular to the radio axis, for several high-ionization lines. The measured horseshoe patterns are indicative of an anisotropic ionizing continuum source with its axis aligned with the radio jet axis. Low-ionization gas was measured as far as 13" south of the radio core position. This study as well as Stockton et al. (1994) show clearly that the sources of ionization for the low- and high-ionization lines are fundamentally different, although some difficulties in interpreting the ionization characteristics remain. For example, the extreme [NII] strength would argue for an as yet not understood substantially enhanced nitrogen abundance.
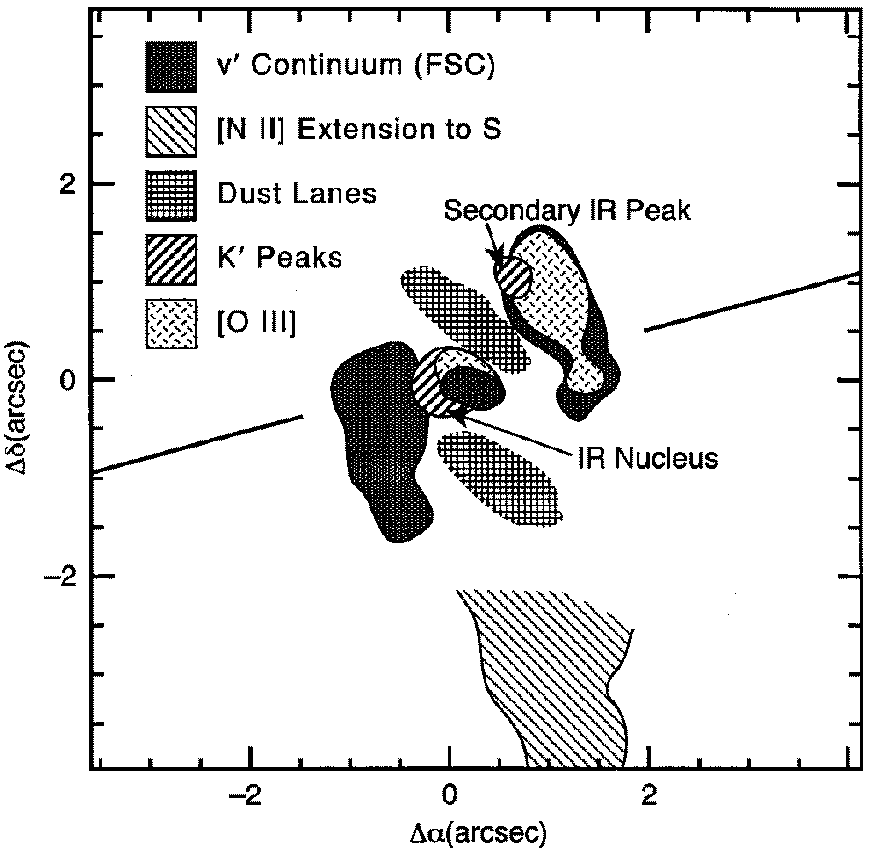
Shaw and Tadhunter (1994) investigated the nature of the featureless continuum, again by high S/N long slit spectroscopy. They measured its extent to be ~ 4 arcsec, aligned with the radio axis, and found it to contribute between 60% and 90% of the total ultraviolet flux. Stockton et al. (1994) point out that the actual fraction may be more uncertain. While it seems that the measurements are consistent with a scattering origin for the featureless continuum, the next section will illustrate that the situation is not that simple. The possibility of free-free emission being responsible for the featureless continuum (Antonucci et al. 1994) was dismissed by Stockton et al. (1994), on grounds of its surface brightness and spectral energy distribution. Figure 13, taken from Stockton et al. (1994) summarizes the above paragraph, sketching the optical picture of the Cygnus A central regions.
|
Figure 13. Schematic diagram showing the major morphological components in the inner region of the Cygnus A galaxy. v' is a 1200 Å wide line-free visual band with a substantial contribution from the (blue) flat-spectrum component (FSC), and K' is a 3500 Å wide near-IR band centered at 2.11µ. The coordinates are centered on the IR/radio nucleus, and the diagonal line indicates the radio axis. Reproduced from Stockton et al. (1994). |