


Results on large-scale structure (LSS) were reported by a number of
speakers at the conference. [Sutherland] described a
determination of the power spectrum of galaxy fluctuations from the
IRAS-based Point Source Catalogue redshift survey
(PSCz).
Using a sample of 14,500 galaxies with 60 µm flux of more
than 0.6 Jy
covering 84% of the sky, the PSCz team find that they are able to
determine the power spectrum, P(k), for wavenumbers down to
0.03 h Mpc-1 (i.e. scales up to 200
h-1 Mpc). The results
(Sutherland et
al. 1999,
Tadros et al. 1999)
are consistent with the earlier QDOT
and 1.2 Jy surveys, although P(k) is significantly better determined.
For plausible values of the small-scale velocity dispersion, P(k) is
well-fit by a CDM-like model with shape parameter

 0.25
and normalisation
0.25
and normalisation  8
0.75 (although assuming a larger
dispersion permits a model with
0.5 to be marginally
acceptable).
8
0.75 (although assuming a larger
dispersion permits a model with
0.5 to be marginally
acceptable).
[Rowan-Robinson] reported an estimate of
 =
=
 0.6 / b
derived from the comparison of the Local Group (LG) motion with respect
to the CMB and the motion predicted from a model based on clusters and
voids identified in the PSCz and the literature (see also
Schmoldt et al. 1999a,
1999b).
The predicted LG dipole has
nearly converged by z = 0.1 (with most of the LG motion generated within
200 h-1 Mpc); linear theory requires
0.7 to fit the observed
amplitude of the LG motion.
0.6 / b
derived from the comparison of the Local Group (LG) motion with respect
to the CMB and the motion predicted from a model based on clusters and
voids identified in the PSCz and the literature (see also
Schmoldt et al. 1999a,
1999b).
The predicted LG dipole has
nearly converged by z = 0.1 (with most of the LG motion generated within
200 h-1 Mpc); linear theory requires
0.7 to fit the observed
amplitude of the LG motion.
[Guzzo] summarised the results of the ESO Slice Project
ESP;
Vettolani et al. 1997)
redshift survey. This
pre-cursor to surveys like the 2dFGRS used photographic sky survey
plates to select a sample of galaxies down to bJ =
19.4 in a single
1° x 35° strip. Redshifts were obtained for 3342
galaxies (85% complete;
Vettolani et al. 1998).
Perhaps the most
significant LSS result to emerge from ESP, is that there is good
evidence for a local under-density of nearly a factor of 2 extending out
to 250 h-1 Mpc
(Zucca et al. 1997).
This is consistent
with the normalisation difference between the luminosity functions
derived from surveys at this depth (ESP itself and the Autofib survey,
Ellis et al. 1996)
and those derived from shallower surveys such as APM-Stromlo
(Loveday et al. 1992).
It also `explains' the origin of the steep
number counts at bright magnitudes
(Maddox et al. 1990),
although it begs the question of the
completeness of the galaxy catalogues derived from photographic surveys
at bright magnitudes. The local void implied by this result would appear
to cover much of the south Galactic cap, as evidenced by the north/south
difference in galaxy density found in the PSCz, LCRS and CfA2 surveys.
Is this void, with an amplitude 
 /
~
0.5
compatible with statistical measures of clustering? The ESP
redshift-space correlation function is in good agreement with other
determinations on scales between 1 and 50 h-1 Mpc,
though a little lower on
the smaller scales. The power spectrum is likewise consistent with other
determinations at wavenumbers k > 0.1 h
Mpc-1. However the small volume
covered by the survey, and its strip geometry, prevent a reliable
determination of P(k) at wavenumbers below about 0.1 h
Mpc-1 (i.e. scales above 60 h-1 Mpc).
/
~
0.5
compatible with statistical measures of clustering? The ESP
redshift-space correlation function is in good agreement with other
determinations on scales between 1 and 50 h-1 Mpc,
though a little lower on
the smaller scales. The power spectrum is likewise consistent with other
determinations at wavenumbers k > 0.1 h
Mpc-1. However the small volume
covered by the survey, and its strip geometry, prevent a reliable
determination of P(k) at wavenumbers below about 0.1 h
Mpc-1 (i.e. scales above 60 h-1 Mpc).
An efficient approach to surveying larger volumes, and so measuring P(k) at smaller k, is to use redshift surveys of clusters, since clusters are about 5x more strongly clustered than galaxies. Results from two such surveys were summarised at the meeting. [Boehringer] and [Guzzo] reported early results from the REFLEX survey, while [Tadros] summarised the results from the first stage of the APM cluster survey.
[Boehringer] noted the advantages of an X-ray selected
cluster sample as being the close correlation between
LX and mass,
and the minimisation of projection effects. He described the detection
of clusters in the ROSAT All Sky Survey for the REFLEX (southern) and
NORAS (northern) samples
(Guzzo et al. 1999).
Together these samples comprise over 900
clusters covering the whole sky at latitudes b > |20°| down to a
flux limit of FX = 3 x 10-12 erg s
cm2. The preliminary
power spectrum derived from the REFLEX survey using a subset of 188
clusters in a 400 h-1 Mpc co-moving cube
(Schuecker et
al. 1998)
appears to show a significant turnover in
P(k) at k
0.04-0.05 h Mpc-1, corresponding to 125-160
h-1 Mpc.
[Guzzo] presented very preliminary results from a larger sample
of clusters in a 1000 h-1 Mpc comoving cube which
confirm the turnover in
P(k). But the newer results also hint at a possible second peak in
P(k) at k ~ 0.01, although a
 = 0.7 flat CDM model
remains consistent within the (large) uncertainties.
= 0.7 flat CDM model
remains consistent within the (large) uncertainties.
[Tadros] described a similar survey, the APM Cluster Redshift Survey
(Tadros et al. 1998).
The first
phase of this survey consisted of 364 clusters drawn from the APM
cluster catalogue of 960 clusters covering 4500 sq.deg. The APM clusters
provide a cleanly-selected sample that is largely unaffected by the
inhomogeneities and projection effects afflicting the Abell catalogue.
The redshift-space cluster-cluster correlation function  cc(s) is
well represented by a power law with index
cc(s) is
well represented by a power law with index
 ~ 2 and a
correlation length of 14 h-1 Mpc (smaller than that of
the Abell
catalogue). The LSS as measured from clusters provides a clean
comparison with cosmological models, since clusters are readily
identified from the dark matter halos without the confusion of a bias
parameter. The APM cc(s) is consistent with
CDM and MDM
models, but has more clustering than is predicted by standard CDM.
~ 2 and a
correlation length of 14 h-1 Mpc (smaller than that of
the Abell
catalogue). The LSS as measured from clusters provides a clean
comparison with cosmological models, since clusters are readily
identified from the dark matter halos without the confusion of a bias
parameter. The APM cc(s) is consistent with
CDM and MDM
models, but has more clustering than is predicted by standard CDM.
An estimate of =
0.6 / b can
be obtained by comparing the
real-space and redshift-space cluster-galaxy cross-correlation functions
cg. The
real-space cg(r) was derived from the cluster
survey and the APM galaxy catalogue by inverting the angular
cluster-galaxy cross-correlation function. The redshift-space
cg(,
 ), as a function of separation in
the plane of the
sky () and along the line of
sight (), was derived from the
cluster survery and the Stromlo-APM redshift survey. These two
cg's can be
related using a model incorporating non-linear
infall and the velocity dispersion of galaxies around clusters.
[Tadros] showed that the best-fit model yields an estimate of
0.4, with a 95% upper
confidence limit of
< 0.7. The power
spectrum from the APM cluster survey shows a
turnover at k
0.03 h Mpc-1, but the median depth of the survey
(270 h-1 Mpc) is only just adequate to measure
P(k) on this 200 h-1 Mpc
scale. To improve the significance of this detection and reduce the
systematic errors, the second phase of the APM cluster survey, now
underway, will obtain redshifts for the remaining clusters in the APM
cluster catalogue, bringing the sample up to 960 clusters. This cluster
survey, which will take 2-3 years to complete, will be particularly
useful since it overlaps with the 2dF Galaxy Redshift Survey.
), as a function of separation in
the plane of the
sky () and along the line of
sight (), was derived from the
cluster survery and the Stromlo-APM redshift survey. These two
cg's can be
related using a model incorporating non-linear
infall and the velocity dispersion of galaxies around clusters.
[Tadros] showed that the best-fit model yields an estimate of
0.4, with a 95% upper
confidence limit of
< 0.7. The power
spectrum from the APM cluster survey shows a
turnover at k
0.03 h Mpc-1, but the median depth of the survey
(270 h-1 Mpc) is only just adequate to measure
P(k) on this 200 h-1 Mpc
scale. To improve the significance of this detection and reduce the
systematic errors, the second phase of the APM cluster survey, now
underway, will obtain redshifts for the remaining clusters in the APM
cluster catalogue, bringing the sample up to 960 clusters. This cluster
survey, which will take 2-3 years to complete, will be particularly
useful since it overlaps with the 2dF Galaxy Redshift Survey.
The faint galaxy correlation function at large angular scales was
discussed by [Brown], who has used digitally-stacked Schmidt
plates to achieve an approximate limit of BJ =
23.5. This gives 700,000
galaxies in each of two 40 sq.deg fields. The median redshift at this
depth is z 0.4. The
correlation function he derives is
well-fit as a power-law,
 (
( )
)  1- with
= 1.7, over the
range 0.05-10 h-1 Mpc. The amplitude of the
correlation function declines as (1 + z)-(3+
1- with
= 1.7, over the
range 0.05-10 h-1 Mpc. The amplitude of the
correlation function declines as (1 + z)-(3+ ) with
0, corresponding to fixed
clustering in physical
coordinates. However these results hide the different clustering
properties of the red and blue galaxies, which are respectively fitted
by models with =
1.8, = -1.3 and scalelength
r0 = 8.6 h-1 Mpc, and
= 1.6,
= -1.5 and
r0 = 3.5 h-1 Mpc.
The clustering amplitude of red galaxies is thus about 5x higher
than the blue galaxies. The lack of any significant strengthening of the
clustering amplitude of blue galaxies out to z ~ 0.4 suggests that
the increase in the population of blue galaxies in clusters with
redshift (the Butcher-Oemler effect) is simply related to the overall
increase in the faint blue galaxy population with redshift.
) with
0, corresponding to fixed
clustering in physical
coordinates. However these results hide the different clustering
properties of the red and blue galaxies, which are respectively fitted
by models with =
1.8, = -1.3 and scalelength
r0 = 8.6 h-1 Mpc, and
= 1.6,
= -1.5 and
r0 = 3.5 h-1 Mpc.
The clustering amplitude of red galaxies is thus about 5x higher
than the blue galaxies. The lack of any significant strengthening of the
clustering amplitude of blue galaxies out to z ~ 0.4 suggests that
the increase in the population of blue galaxies in clusters with
redshift (the Butcher-Oemler effect) is simply related to the overall
increase in the faint blue galaxy population with redshift.
The LSS goals of the
2dFGRS, and some
preliminary results from the survey, were described by
[Dalton]. The main LSS goals are: (i) the determination of
P(k) on large scales ( > 100 h-1 Mpc); (ii) the
topology of the 3D
distribution; (iii) tests of gaussianity (on large scales) and biasing
(on small scales) from higher-order statistics; (iv) estimation of the
mass density and the bias
parameter(s) b from the
redshift-space distortions. Dalton discussed the tiling and
fibre-assignment algorithms used in the survey, and showed that the
restrictions on minimum fibre separations mean the survey is
significantly biased against close pairs with separations less than
2 arcmin (corresponding to 150 h-1 kpc at the median
depth of the survey,
z = 0.1). This effect, and the variation in redshift completeness with
apparent magnitude, are taken into account when estimating or simulating
the large-scale structure statistics derived from the survey.
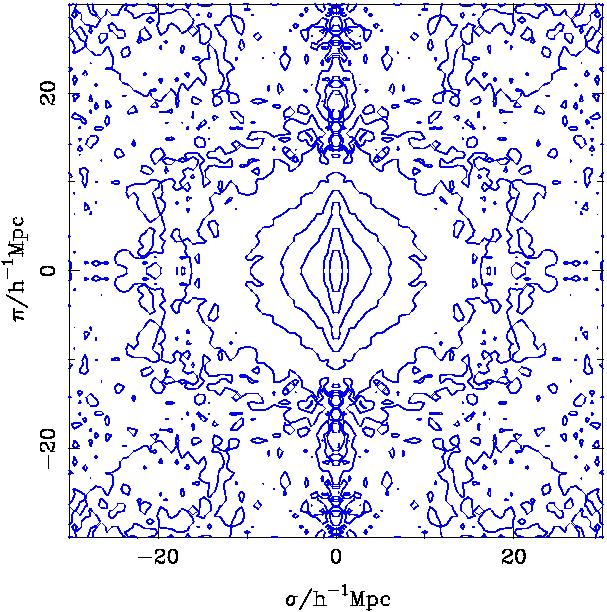
[Dalton] showed preliminary determinations of the
redshift-space correlation function
(, ) for the 2dFGRS.
There is very good agreement with the results obtained from the Las
Campanas Redshift Survey
(LCRS). The
distortions in (, ) shown in
Figure 4 are
roughly consistent with a model with
=
0.6 / b
0.5
and small-scale velocity dispersion 400 km
s-1. A similar
value for emerges
from the quadrupole to monopole ratio of the
redshift-space distortions on large scales. As a consistency check on
the results, the projected correlation function
 (r), derived by integrating over
(, ), has been compared to that obtained
by Baugh & Efstathiou (1993)
from a deprojection of the angular correlation function of the parent APM
galaxy catalogue. There is excellent agreement on scales up to 30
h-1 Mpc,
while on larger scales the cosmic variance dominates the uncertainties
in the as-yet-incomplete 2dFGRS.
(r), derived by integrating over
(, ), has been compared to that obtained
by Baugh & Efstathiou (1993)
from a deprojection of the angular correlation function of the parent APM
galaxy catalogue. There is excellent agreement on scales up to 30
h-1 Mpc,
while on larger scales the cosmic variance dominates the uncertainties
in the as-yet-incomplete 2dFGRS.
|

|
Figure 4. The 2dFGRS redshift-space
correlation function,
|
In a similar vein, [Szalay] showed the results of simulations
indicating the precision that the Sloan survey will achieve in
recovering cosmological parameters from LSS statistics. SDSS should be
able to measure the power spectrum normalization
8 to a
precision of 5%, the power spectrum shape parameter
to 20%,
and the redshift-distortion parameter
(which involves both the
mass density and the bias
parameter b,
=
0.6 / b) to
35%. The precision with which P(k) will be
determined is illustrated in Figure 5, which
shows both the
effective window functions of various surveys and the simulated recovery
of P(k) from the Sloan survey, with estimated errors.
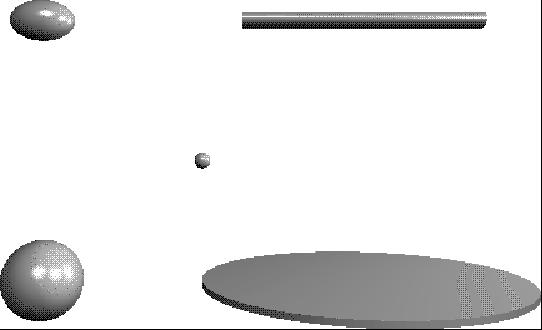
|
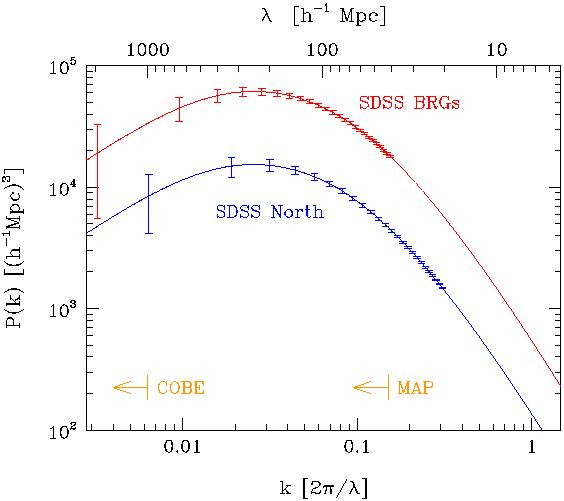
|
Figure 5. (a) The window function functions for various surveys: lower left is QDOT, upper left is CfA2, upper right is LCRS, lower right is the BEKS pencil-beam survey, and the small dot in the center is SDSS and 2dFGRS (from the SDSS Black Book). (b) The prediction for the recovered power spectrum and estimated errors from the SDSS main northern galaxy sample and from the Bright Red Galaxy sample (Loveday & Pier 1998). The scales covered by the COBE and MAP cosmic microwave background probes are also indicated. |
On larger scales of both space and time, [Croom] reported
preliminary LSS results for the
2dF QSO Redshift Survey. The LSS goals of
the QSO survey are: (i) determining the QSO P(k) out to scales
~ 1000 h-1 Mpc; (ii) measuring the cosmological
constant from
geometrical (as opposed to dynamical) distortions of clustering in
redshift space; (iii) tracing the evolution of QSO clustering out to
z ~ 3 to constrain
and the QSO bias parameter. As
with the
galaxy survey, corrections are needed for the partial coverage of
overlapping fields, the deficit of close pairs and Galactic extinction.
Preliminary determinations of the 0.3 < z < 2.2 QSO correlation
function using 2765 QSOs give
1.4 and scaling lengths
r0 3
h-1 Mpc and for r0
5 h-1 Mpc
for models with
(M = 1,
= 0) and
(M = 0.3,
= 0.7) respectively, with
the clustering
appearing to be constant in comoving coordinates over this range. With
the full QSO survey it should be possible to measure
to 3% and
r0 to 5% on small scales, and on large scales to
measure P(k) on scales k > 0.01 h Mpc-1 (i.e.
< 600 h-1 Mpc).
Other cosmological parameters were addressed by Mould and Peterson. [Mould] summarised the results from the HST Key Project to measure the Hubble constant, H0 (Mould et al. 1999). This work essentially consists of using Cepheid distances to calibrate a wide variety of distance estimators, including type Ia supernovae, the Tully-Fisher relation for spiral galaxies, and the Fundamental Plane and surface brightness fluctuations for bulge-dominated galaxies. The available data from all these estimators yield consistent values for H0, and the combined best estimate, after correcting for the chemical composition dependence of the Cepheid period-luminosity relation, is H0 = (68 ± 6) km s-1 Mpc-1 (including random and systematic errors), for an assumed LMC distance of 50 ± 3 kpc. [Rowan-Robinson] also gave an estimate of the Hubble constant using a similar compilation of methods based on the Key Project Cepheid distances, but with the addition of corrections for peculiar velocities based on the PSCz flow model. He finds H0 = (65 ± 2) km s-1 Mpc-1 (random error only).
[Mould] also considered the possibility that we inhabit a large
local void with -0.5 < n /
n < -0.2, as suggested by [Guzzo]
from the results of the ESP survey, and as is consistent with the
preliminary results from the 2dFGRS. Since H0 / H0 =
1/3
n / n
this would imply (for =
0.6 / b
0.5) that 0.92 <
H0global /
H0local < 0.97.
[Peterson] addressed the question of whether a cosmological
constant is demanded by the galaxy number counts. He finds that the
surface density of faint galaxies derived from the optical and
near-infrared number counts is too high to be compatible with a
M = 1 cosmology, and
are much better fitted by a low-density flat
universe with 0.8. Although this claim depends
on the assumed evolutionary history of the galaxies, Peterson argued
that models which reproduce the number counts by invoking merger-driven
evolution are inconsistent with the low measured amplitude of the
angular correlation function for faint galaxies.