


2.3. Hot Gas
Hot gas and its X-ray emission are the keys to follow the fate of gas in interactions. Read & Ponman (1998) have followed a merger sequence and found that the X-ray luminosity is enhanced by the interaction, although not as much as the FIR luminosity. Spatially, the X-ray emission is not correlated with tidal tails; the hot gas is ejected in winds, powered by the central starbursts. The classical M82-type bipolar outflow is often replaced by unipolar outflows in violent mergers.
In merger remnants (like in NGC 7252) LX falls down again. This is surprising since such remnants are bound to become classical ellipticals, which have more hot gas than spirals (e.g. Fabbiano, 1989). How is done the transformation? At the base of the tidal tails, in NGC 7252, the HI is falling back, as revealed by its kinematics (Hibbard et al. 1994), but then stops suddenly. It is not replaced by H2 gas, that is concentrated much further in. It is likely that the returning gas is heated by shocks to form a hot gas halo. This will take a time-scale of the order of Gyrs to form a genuine elliptical.
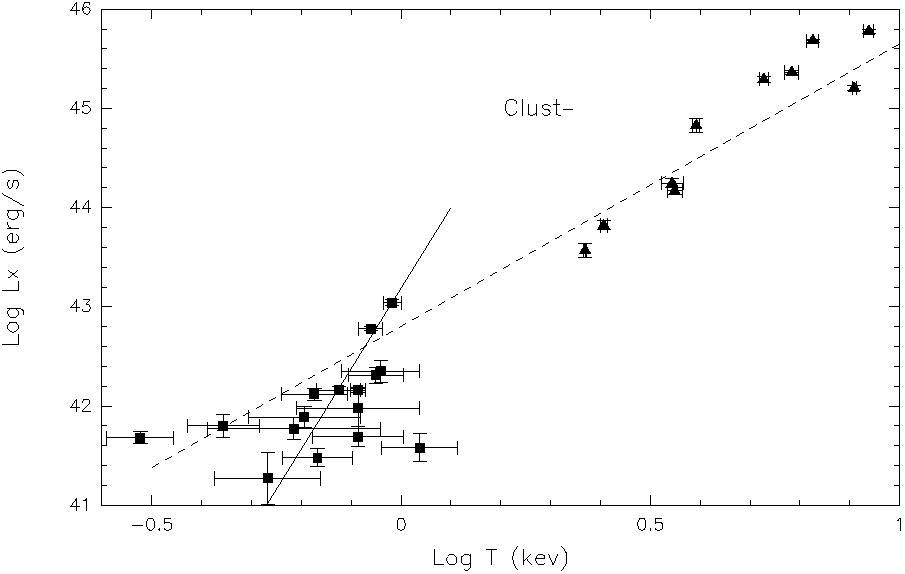
In small groups, the hot gas is even more extended, up to 400 kpc (Davis et al. 1995). The amount of hot gas is such that 20 to 34% of the mass is baryonic. This cannot be done by galactic winds (Ponman et al. 1996, Mulchaey et al. 1996). About 75% of compact groups have detectable X-ray emission (Ponman et al 1996). In small groups, the hot gas metallicity is low (lower than in clusters). In the LX-T diagram, the compact groups occupy a special region, after a turn-over: they have less luminosity for a given temperature than would be expected from clusters (cf fig. 1). This could be due to the influence of galactic winds, creating a hole in the center, while winds have no influence in clusters (Ponman et al 1996). Alternatively, the hot gas could be progressively heated, through interactions, and have not yet reached equilibrium in small groups. This would be the case if the hot gas comes from the cold molecular gas in outer parts of galaxies (Pfenniger & Combes 1994).
|
Figure 1. Lx vs T for HCG (filled squares), and clusters (filled triangles), from Ponman et al. (1996). The dashed line is the best regression fit for clusters, and full line for HCGs. |