


3.2 Millimetre and infrared emission
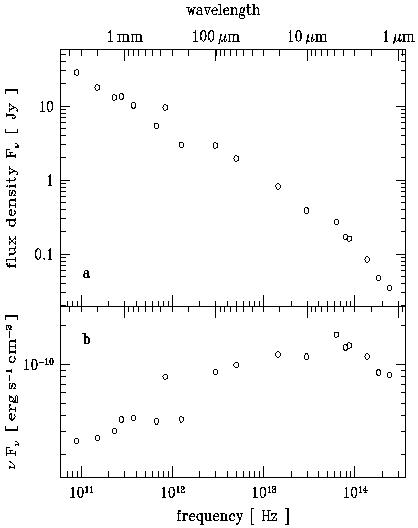
Figure 5 gives the average spectrum between 1011 Hz and 1014 Hz extracted from Fig. 1. This continuum spectral energy distribution is characterised by a power law of index of 0.7 ± 0.1 (between 10 µm and 100 µm) and a "bump" around a few microns (see below).
|
Figure 5. The average millimetre-infrared spectrum of 3C 273. Data from Fig. 1. Panels as in Fig. 4. |
Early infrared data are presented in
(Neugebauer et
al. 1979) and in
(Rieke & Lebofsky 1979).
(Neugebauer et al. 1979)
note that the 3 µm
flux of 3C 273 and other quasars is in excess of a power law that
would link the 1 µm and the far infrared fluxes. They suggest
that this bump (easier to see in the
 .
f representation)
around 3 µm may be due to the presence of heated dust, the
emission of which is superimposed on the non thermal emission that
extends smoothly from the radio domain. A similar conclusion is
reached by
(Allen 1980).
The presence of dust within the nucleus
might also explain the ratio of
Ly
.
f representation)
around 3 µm may be due to the presence of heated dust, the
emission of which is superimposed on the non thermal emission that
extends smoothly from the radio domain. A similar conclusion is
reached by
(Allen 1980).
The presence of dust within the nucleus
might also explain the ratio of
Ly to
H fluxes which
is an order of magnitude less than the theoretical predictions
(Hyland et al. 1978).
Dust located within the line emitting region
could, according to these authors, lower this line ratio
through reddening effects. Indeed, even small amounts of reddening
will considerably decrease the
Ly flux while the
H
flux will remain nearly unperturbed. Continuum observations suggest,
however, that this dust does not redden the continuum in the same way.
There is in fact no indication of substantial reddening in either the
UV domain or the X-ray domain (see below) in excess to that caused
within our Galaxy.
to
H fluxes which
is an order of magnitude less than the theoretical predictions
(Hyland et al. 1978).
Dust located within the line emitting region
could, according to these authors, lower this line ratio
through reddening effects. Indeed, even small amounts of reddening
will considerably decrease the
Ly flux while the
H
flux will remain nearly unperturbed. Continuum observations suggest,
however, that this dust does not redden the continuum in the same way.
There is in fact no indication of substantial reddening in either the
UV domain or the X-ray domain (see below) in excess to that caused
within our Galaxy.