

3.3 The blue bump
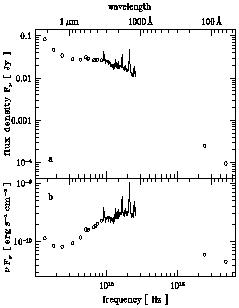
Seyfert galaxies and quasars are generally characterized by an excess emission in the optical UV region of the spectrum when compared to the high frequency extrapolation of the infrared continuum. 3C 273 is no exception. This excess has been called the blue bump or the big blue bump to distinguish it from a smaller bump due to blended FeII lines. We will use the first name here. Figure 6 gives the average spectrum obtained in the optical and ultraviolet domains.

|
Figure 6. The average optical-ultraviolet spectrum. Data from Fig. 1. Panels as in Fig. 4. |
It has been proposed by (Shields 1978) that the blue bump might be due to thermal emission from the surface of an optically thick but geometrically thin accretion disc. The structure of these discs in which the energy released at each radius is the gravitational energy locally lost by the gas spiraling inward had been calculated by (Shakura & Sunyaev 1973). The emitted spectrum is the superposition of black bodies of temperatures decreasing from the inner radius to the outer radius of the disc. (Ulrich 1981) and (Malkan & Sargent 1982) fitted the observed blue bump emission with this model which they approximated by a single temperature blackbody. The temperatures they deduced from the fits were 21 000 K and 26 000 K respectively. The size of the source was estimated from the Stephan-Boltzmann law to be close to 1016 cm using the observed flux and assuming as we do here H0 = 50 km/sMpc and isotropic emission. More detailed attempts to represent the optical-ultraviolet emission of 3C 273 using standard accretion disc models followed.
The blue bump is broader than the spectrum of a single black body.
Accretion discs do have a distribution of temperatures. Fits to the
data therefore improved when disc models replaced single temperature
representations
(Malkan 1983).
The accretion disc models can be
parametrized in terms of the central mass of the black hole and the
accretion rate.
(Malkan 1983)
obtained from his fit to the 3C 273
optical and UV data a mass between 2 and 5 108 solar masses for the
mass of the black hole and an accretion rate
 between 4 and
12 solar masses per year. The resulting ratio of the luminosity to the
Eddington luminosity (the luminosity for which gravitational
attraction and radiation pressure balance each other) was slightly
larger than 1. It must be noted that these fits depend on the
assumptions made for the underlying components. Different
extrapolations of the infrared flux onto which the blue bump is added
lead to different blue bump spectral energy distributions to be fitted
by the models
(Camenzind &
Courvoisier 1984).
These early papers were followed by a large effort in which different assumptions were made to describe the components other than the disc emission (in particular the possibly underlying extrapolation of the infrared component and the free bound emission were taken into account). Meanwhile the accretion disc models grew more complete, including optically thin parts and a corona. These models can account for many features of the blue bump emission of quasars and are a natural consequence of accretion of matter with some angular momentum provided that an adequate source of viscosity is available to transport angular momentum towards the outer regions of the nucleus. (Czerny 1994) provides a review of the arguments in favour of these models.
There are, however, a number of difficulties with the accretion disc model in the case of 3C 273 and other well studied Seyfert galaxies (Courvoisier & Clavel 1991). These difficulties relate to the shape of the continuum emission, the dependence of this shape on the luminosity of the objects and the variations observed in the blue bump emission (see below).