
This parameter is analogous to the R23
parameter defined for the optical oxygen lines and hereafter we will refer to
the oxygen and sulphur abundance parameters as O23 and
S23 respectively. Both parameters are listed in
Table 2.
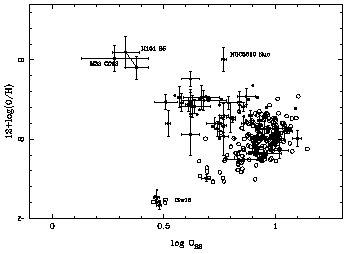
The relation between O23 and the oxygen
abundance for the objects in Table 2 can be
seen in the upper panel of
Fig. 1 (solid dots) together
with similar data for HII galaxies compiled by
Díaz (1999)
(open circles).
The figure illustrates the problems mentioned in the introduction, the most
important one being the two-valued nature of the relation which makes an
accurate metallicity calibration virtually impossible, more so for objects
with logO23  0.8. Also
notice the position of the nucleus of NGC 3310
which is probably due to its higher than usual density
(nH = 8000 cm-3;
Pastoriza et al. 1993).
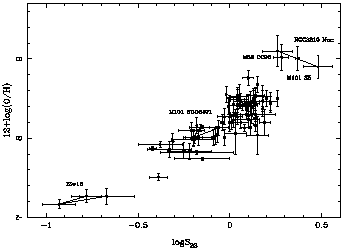
On the contrary, and as expected, the relation between S23
and oxygen abundance for the objects of Table 2,
shown in the lower panel of the figure, remains single valued up to a
metallicity close to solar. In both figures the data corresponding to
different observations of IZw18, NGC 5471 in M101, and S5 in M101 have
been joined together to show the importance of internal errors. The
solar metallicity regions have also been labelled.
|
|
Figure 1. Oxygen abundance parameter (upper
panel) and sulphur abundance parameter (lower panel) vs oxygen
abundance for the objects in
Table 2 and HII galaxies in
Díaz (1999).
|
Also, as compared to the case of O23, the scatter in the
relation between S23 and oxygen abundance is somewhat reduced.
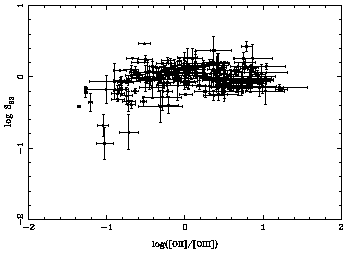
The dependence of O23 on the degree of
ionization of the nebula is partially responsible for the large
scatter found in the O23 vs metallicity relation.
Figure 2 (upper panel) shows the relation
between logO23 and log([OII]/[OIII]),
which can be taken as a good ionization parameter indicator for ionizing
temperatures larger than about 35000 K (see
Díaz 1999),
for the
objects in Table 1. A positive correlation
between ionization parameter and O23 is evident for
objects with O23 between 0.2 and 1 (higher excitation objects
are at the left in the plot). On the contrary,
no relation between logS23 and log([OII]/[OIII]) is readily
apparent in the lower panel of the figure. The peculiar position of
IZw18 in the plots is due to its very low metallicity.

|
|
Figure 2. Relation between
logO23 (upper panel) and logS23 (lower panel with
log([OII]/[OIII]), taken as ionization parameter indicator, for
the objects in Table 1.
|
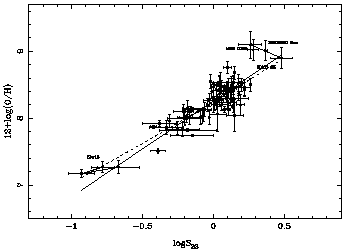
Based on the above considerations, we have attempted a calibration of
oxygen abundance through the sulphur abundance parameter S23,
using the
data of Table 2 with the exclusion of the
three objects for which no direct
determinations of the electron temperature exist: S5 in M101, CC93 in M33 and
the nucleus of NGC 3310. A linear fit to the data, taking into
account the observational errors, give:

with a correlation coefficient of 0.88 and a value of
 = 0.15.
The data points corresponding to IZw18 deviate slightly from linearity. This
is due to the high excitation of this object which increases the fraction of
S++ converted to S3+ thus decreasing S23.
A quadratical fit:

provides a better fit to these extremely low metallicity data.
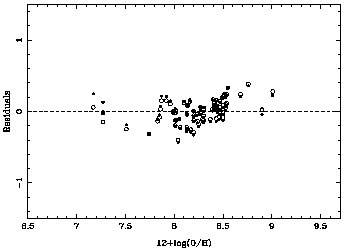
The two fits are shown in the upper panel of
Figure 3 by a solid and a dashed
line respectively. The corresponding residuals are shown in the lower panel as
a function of the oxygen abundance. Solid dots correspond to the linear fit
while open circles correspond to the quadratic one.
|
|
Figure 3. Empirical calibration of oxygen
abundance through the sulphur
abundance parameter S23. The ressiduals of the fits are
shown in the lower panel of the figure (see text for details).
|
Figure 4 shows the relation between
S23 and O23.
The largest value of S23 corresponds to one of the
observations of region
S5 in M101 (S23 = 0.48), and the solar
metallicity objects have S23
between 0.28 and 0.48. On the other hand, the object with the lowest
metallicity known,
IZw18, has a value of logO23 =
0.47. These two facts taken
together imply that objects with logO23
 0.47 and -0.5 <
logS23
 0.28 will necessarily
have oversolar abundances. These objects are 48 out of the 196 listed in
Table 1 and therefore constitute about a
quarter of the total
sample. Most of them are circumnuclear star forming regions, HII regions
in inner galactic discs and HII regions in Virgo cluster galaxies.

|
Figure 4. Relation between O23
and S23 for the objects in Table 1.
|
For logO23 < 0.45 it can be seen that for the lowest
metallicity objects
there is a positive correlation between O23 and
S23; NGC 5471, with
logO23  1.00 and
logS23
  0.10, would
lie at the end of
this correlation. Then, there is a trend of increasing S23 with
decreasing O23 which corresponds to the "upper
metallicity branch" of the
O23 abundance calibration. For values of logO23
between 0.45 and 0.00,
the relation between the two abundance parameters is rather flat. Finally, for
values of logO23 < 0.0 a trend of decreasing S23
with decreasing
O23 is apparent, indicating that, for the metallicities
involved, the
expected reversal of the S23 vs metallicity relation
has already taken place.

|
Figure 5. Variation of
log(S23/O23) with galactic radius for M101,
which actally mimics a logarithmic abundance gradient through the
disc.
|
The behaviour of the O23 and S23 parameters is
related with the
different energies involved in the two sets of transitions and therefore
a combination of both should, in principle, be a better indicator of
metallicity
than either of them alone. Figure 5 shows a plot
of log(S23/O23) for the
HII regions in M101
(Kennicutt & Garnett
1996).
A single line logarithmic
gradient is found. This might actually constitute a purely observational
way to quantify galactic disc abundance gradients without the need to
rely on theoretical photoionization models.


 0.8. Also
notice the position of the nucleus of NGC 3310
which is probably due to its higher than usual density
(nH = 8000 cm-3;
Pastoriza et al. 1993).
On the contrary, and as expected, the relation between S23
and oxygen abundance for the objects of Table 2,
shown in the lower panel of the figure, remains single valued up to a
metallicity close to solar. In both figures the data corresponding to
different observations of IZw18, NGC 5471 in M101, and S5 in M101 have
been joined together to show the importance of internal errors. The
solar metallicity regions have also been labelled.


 = 0.15.


 0.47 and -0.5 <
logS23
 0.28 will necessarily
have oversolar abundances. These objects are 48 out of the 196 listed in
Table 1 and therefore constitute about a
quarter of the total
sample. Most of them are circumnuclear star forming regions, HII regions
in inner galactic discs and HII regions in Virgo cluster galaxies.

 1.00 and
logS23
  0.10, would
lie at the end of
this correlation. Then, there is a trend of increasing S23 with
decreasing O23 which corresponds to the "upper
metallicity branch" of the
O23 abundance calibration. For values of logO23
between 0.45 and 0.00,
the relation between the two abundance parameters is rather flat. Finally, for
values of logO23 < 0.0 a trend of decreasing S23
with decreasing
O23 is apparent, indicating that, for the metallicities
involved, the
expected reversal of the S23 vs metallicity relation
has already taken place.
