


The power spectra of matter and the angular spectra of CMB can be calculated for a set of cosmological parameters using the CMBFAST algorithm [50]; spectra are COBE normalized. The cluster abundance and mass distribution functions can be calculated by the Press-Schechter [44] algorithm. We have used these algorithms to test how well cosmological parameters are in agreement with these descriptive functions.
One problem in comparing cosmological models with observations is related to the fact that from observations we can determine the power spectra and correlation functions of galaxies and clusters of galaxies, but using models we can do that for the whole matter. Power spectra of galaxies and matter are related through the bias parameter. There exist various methods to estimate the bias parameter, using velocity data. Here we use another method which is based on the numerical simulation of the evolution of the Universe. During dynamical evolution matter flows away from low-density regions and forms filaments and clusters of galaxies. This flow depends slightly on the density parameter of the model. The fraction of matter in the clustered population can be found by counting particles with local density values exceeding a certain threshold. To separate void particles from clustered particles we have used the mean density, since this density value divides regions of different cosmological evolution, see eq. (1). Hydrodynamical simulations by Cen & Ostriker [12] confirmed that galaxy formation occurs only in over-dense regions.
We express the epoch of simulations through the
 8 parameter,
which was calculated by integrating the power spectrum of matter. It
is related to the observed value of
(8)gal by
the equation
(compare with eq. (5, 6))
8 parameter,
which was calculated by integrating the power spectrum of matter. It
is related to the observed value of
(8)gal by
the equation
(compare with eq. (5, 6))
| (11) |
here we assume that
bgal = bc. This equation, and the observed
value of
(8)gal,
yields one equation between
(8)m and
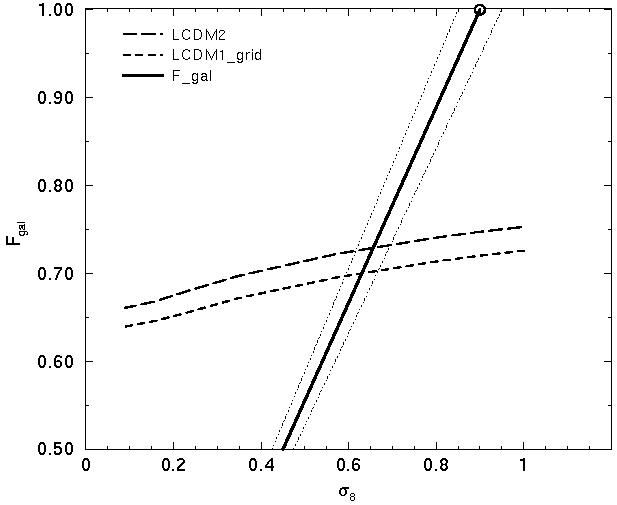
bc (or Fgal); it is shown in the
upper left
panel of Figure 6 by a bold line with error corridor.
The other equation is given by the growth of Fgal with
epoch. For two LCDM models with density parameter
 m
m
 0.4 the
growth of Fgal is shown by dashed curves in the upper
left panel
of Figure 6
[23].
By simultaneous solution of
both equations we found all three quantities of interest for the
present epoch: rms density fluctuations of matter
(8)m =
0.64 ± 0.06, the fraction of matter in the clustered population,
Fgal = 0.70 ± 0.09, and the biasing parameter
bgal = 1.4 ± 0.1.
0.4 the
growth of Fgal is shown by dashed curves in the upper
left panel
of Figure 6
[23].
By simultaneous solution of
both equations we found all three quantities of interest for the
present epoch: rms density fluctuations of matter
(8)m =
0.64 ± 0.06, the fraction of matter in the clustered population,
Fgal = 0.70 ± 0.09, and the biasing parameter
bgal = 1.4 ± 0.1.
| 
|

| 
|
Figure 6. Upper left: the fraction of
matter in the clustered population associated with galaxies as a function of
| |
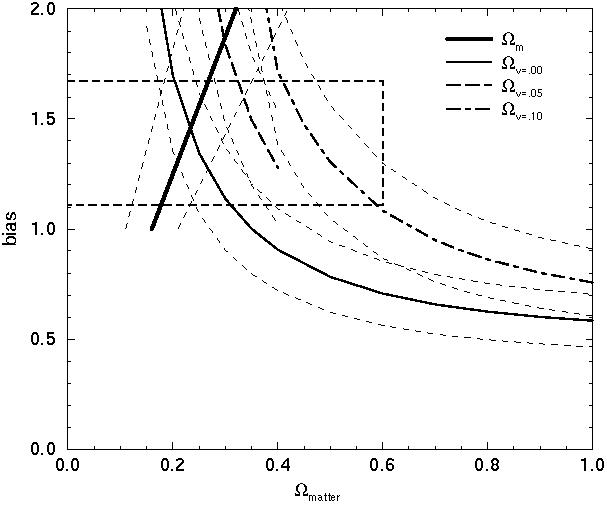
The CMBFAST algorithm yields for every set of cosmological parameters
the 8 value for
matter. It is calculated using the linear growth
model of density perturbations. From observations we know this
parameter for galaxies,
(8)gal. Using eq. (11)
we can calculate the biasing parameter bgal, needed to
bring the
theoretical power spectrum of matter into agreement with the observed
power spectrum of galaxies. This parameter must lie in the range
allowed by numerical simulations of the evolution of structure.
Results of calculations for a range of
m are shown in the upper
right panel of Figure 6, using the Hubble constant
h = 0.65, baryon density
b = 0.05, and HDM
densities
n = 0.00, 0.05,
0.10. The biasing parameter range shown in the Figure
is larger than expected from calculations described above; this range
corresponds to the maximum allowed range of the fraction of matter in
the clustered population expected from analytic estimates of the speed
of void evacuation.
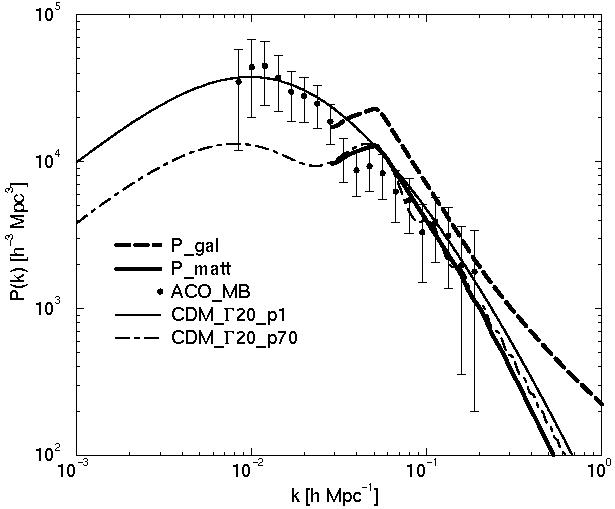
Power spectra for LCDM models
(n = 0;
0.2  m
0.5) are shown in the lower left
panel of Figure 6. We see that with increasing
m the amplitude of
the power spectrum on small scales (and respective
8 values) increases,
so that for high m
the amplitude of the matter power spectrum
exceeds the amplitude of the galaxy power spectrum. This leads to bias
parameter values b 1. Such
values are unlikely since the
presence of matter in voids always increases the amplitude of the
galaxy power spectrum relative to the matter spectrum. If other
constraints demand a higher matter density value, then the amplitude
of the matter power spectrum can be lowered by adding some amount of
HDM. However, supernova and cluster X-ray data exclude density values
higher than
m
0.4; thus the possible
amount of HDM is
limited. The lower right panel of the Figure 6 shows
the angular spectrum of temperature anisotropies of CMB for different
values of the density parameter
m. We see that a low
amplitude of the first Doppler peak of the CMB spectrum prefers a
higher m value: for
small density values the amplitude is too
high. So a certain compromise is needed to satisfy all data.
m
0.5) are shown in the lower left
panel of Figure 6. We see that with increasing
m the amplitude of
the power spectrum on small scales (and respective
8 values) increases,
so that for high m
the amplitude of the matter power spectrum
exceeds the amplitude of the galaxy power spectrum. This leads to bias
parameter values b 1. Such
values are unlikely since the
presence of matter in voids always increases the amplitude of the
galaxy power spectrum relative to the matter spectrum. If other
constraints demand a higher matter density value, then the amplitude
of the matter power spectrum can be lowered by adding some amount of
HDM. However, supernova and cluster X-ray data exclude density values
higher than
m
0.4; thus the possible
amount of HDM is
limited. The lower right panel of the Figure 6 shows
the angular spectrum of temperature anisotropies of CMB for different
values of the density parameter
m. We see that a low
amplitude of the first Doppler peak of the CMB spectrum prefers a
higher m value: for
small density values the amplitude is too
high. So a certain compromise is needed to satisfy all data.
The cluster mass distribution for LCDM models
0.2
m
0.3 is shown in the left panel of
Figure 7. We see that
low-density models have a too low abundance of clusters over the whole
range of cluster masses. The best agreement with the observed cluster
abundance is obtained for a LCDM model with
m = 0.3, in good
agreement with direct data on matter density. In this Figure we show
also the effect of a bump in the power spectrum, which is seen in the
observed power spectrum of galaxies and clusters
[22].
Several modifications of the inflation scenario predict the formation
of a break or bump in the power spectrum. The influence of the break
suggested by Lesgourgues, Polarski and Starobinsky
[32] was
studied by Gramann and Hütsi
[28].
Another mechanism was suggested by Chung
[13].
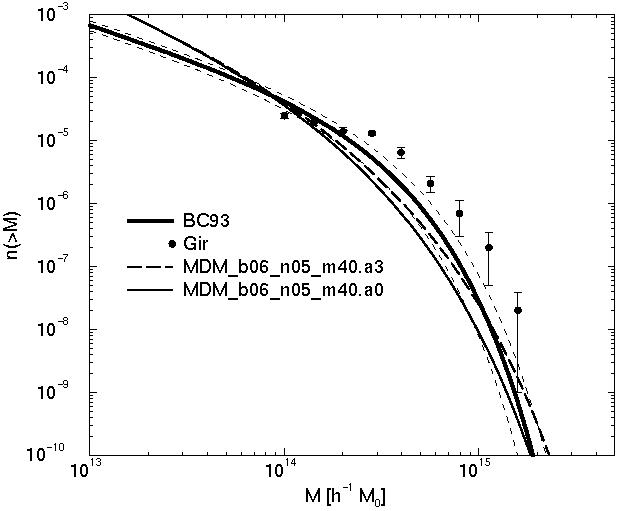
To investigate the latter case
we have used a value of
k0 = 0.04 h Mpc-1 for the long wavenumber
end of the bump, and
a = 0.3 - 0.8 for the amplitude parameter. Our
results show that such a bump only increases the abundance of very
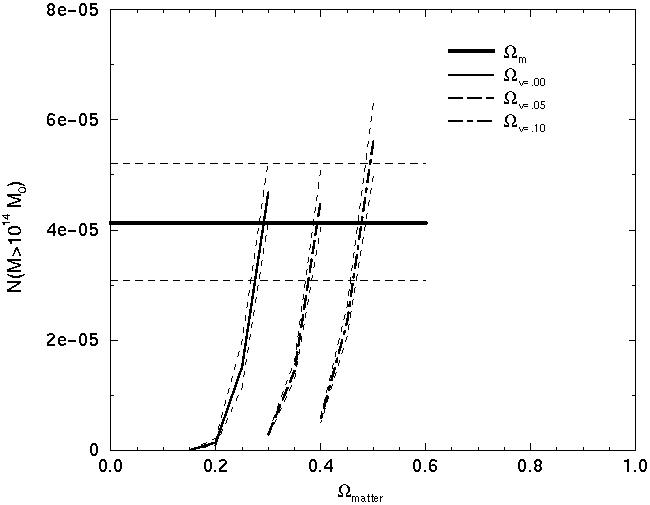
massive clusters. In the right panel of Figure 7
we show
the cluster abundance constraint for clusters of masses exceeding
1014 solar masses; the curves are calculated for LCDM and MDM
models with
n = 0.00, 0.05,
0.10. We see that the cluster
abundance criterion constrains the matter and HDM densities in a
rather narrow range.

| 
|
Figure 7. Left: cluster mass
distribution for LCDM models of various
density | |
The power spectra of LCDM models with and without the Starobinsky
break are shown in the upper left panel of Figure 8;
these models were calculated for the parameter
 =
mh = 0.20. In
the case of the spectrum with a bump we have used MDM
models as a reference due to the need to decrease the amplitude of the
spectrum on small scales; these spectra are shown in the upper right
panel of Figure 8. Power spectra are compared with the
observed galaxy power spectrum
[22]
and with the new cluster
power spectrum [38],
reduced to the amplitude of the galaxy
power spectrum. Also the matter power spectrum is shown, for which we
have used a biasing factor bc = 1.3
[23].
We see that the
Starobinsky model reproduces well the matter power spectrum on small
and intermediate scales, but not the new data by Miller & Batuski.
The modification by Chung
[13]
with amplitude parameter
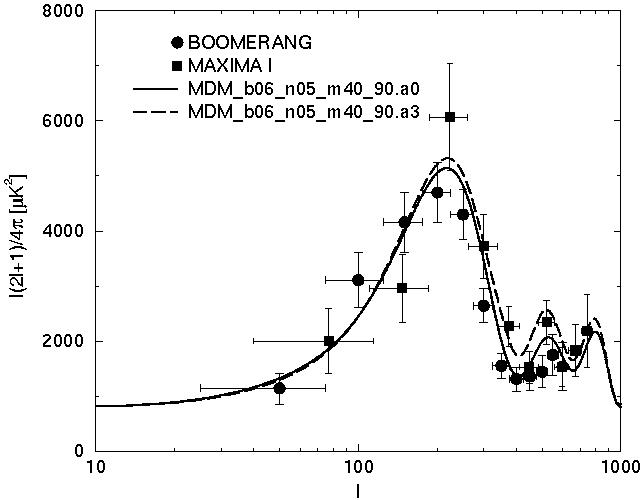
a = 0.3 fits well all observational data. The cluster mass
distribution for the Chung model is shown in the lower left panel of
Figure 8, and the angular spectrum of CMB temperature
fluctuations in the lower right panel of Figure 8. In
order to fit simultaneously the galaxy power spectrum and the CMB
angular spectrum we have used a tilted MDM model with parameters
n = 0.90,
b = 0.06,
n = 0.05, and
m = 0.4.
=
mh = 0.20. In
the case of the spectrum with a bump we have used MDM
models as a reference due to the need to decrease the amplitude of the
spectrum on small scales; these spectra are shown in the upper right
panel of Figure 8. Power spectra are compared with the
observed galaxy power spectrum
[22]
and with the new cluster
power spectrum [38],
reduced to the amplitude of the galaxy
power spectrum. Also the matter power spectrum is shown, for which we
have used a biasing factor bc = 1.3
[23].
We see that the
Starobinsky model reproduces well the matter power spectrum on small
and intermediate scales, but not the new data by Miller & Batuski.
The modification by Chung
[13]
with amplitude parameter
a = 0.3 fits well all observational data. The cluster mass
distribution for the Chung model is shown in the lower left panel of
Figure 8, and the angular spectrum of CMB temperature
fluctuations in the lower right panel of Figure 8. In
order to fit simultaneously the galaxy power spectrum and the CMB
angular spectrum we have used a tilted MDM model with parameters
n = 0.90,
b = 0.06,
n = 0.05, and
m = 0.4.
| 
|
| 
|
Figure 8. Upper left: power spectra of a LCDM model with and without Starobinsky modification. Upper right: power spectra of MDM models with and without Chung modification. Lower left: cluster mass distributions for MDM models with and without Chung modification. Lower right: angular power spectra of tilted MDM models with and without Chung modification (amplitude parameter a = 0.3). | |
BOOMERANG and MAXIMA I data have been used in a number of studies to
determine cosmological parameters
[7,
17,
30,
56,
59]. In
general, the agreement between various determinations is good;
however, some parameters differ. There is a general trend to
interpret new CMB data in terms of a baryon fraction higher than
expected from the nucleosynthesis constrain;
h2b
= 0.03. Tegmark & Zaldarriaga
[56]
suggested a relatively high matter density,
h2m
= 0.33. On the other hand, velocity data
suggest a relatively high amplitude of the power spectrum,
8m0.6 = 0.54,
which in combination with distant supernova
data yields
m = 0.28 ±
0.10, and
8 = 1.17 ± 0.2
[7].
Our analysis has shown that a high value of the density of matter,
m > 0.4, is
difficult to reconcile with current data on
supernova and cluster abundances. Similarly, a high amplitude of the
matter power spectrum,
8 > 1, seems
fairly incompatible with
the observed amplitude of the galaxy power spectrum and reasonable
bias limits. This conflict can be avoided using a tilted initial
power spectrum, and a MDM model with a moderate fraction of HDM, as
discussed above. The best models suggested so far have
0.3
m
0.4,
0.90
n 0.95,
0.60 h
0.70,
n
0.05. Matter density values lower
than 0.3 are
strongly disfavoured by the cluster abundance constraint, and values
higher than 0.4 by all existing matter density estimates. This upper
limit of the matter density, in combination with the cluster abundance
and the amplitude of the power spectrum, yields an upper limit to the
density of hot dark matter. We can consider this range of
cosmological parameters as a set which fits well all constraints.
This set of cosmological parameters is surprisingly close to the set
suggested by Ostriker & Steinhardt
[40]. Now it
is supported by much more accurate observational data.
Acknowledgements
I thank M. Einasto, M. Gramann, V. Müller, A. Starobinsky, E. Saar and E. Tago for fruitful collaboration and permission to use our joint results in this review, and H. Andernach for suggestions to improve the text. This study was supported by the Estonian Science Foundation grant 2625.