

I would conclude that the much-heralded 'synthesis' of theory and data is premature. We have also only just scratched on the surface of the HDF data. Indeed, much of the recent progress is based merely on the integrated colours of HDF galaxies; we have hardly begun exploiting the 2-D resolved data which is the true benefit of using HST. I will conclude by illustrating the next step in this sense which is based on preliminary work done in Cambridge (Abraham et al. 1997, for a preliminary discussion see Abraham 1997).
Instead of using integrated 4-colour data to estimate redshifts, why not
use those sources for which spectroscopic redshifts are available
(Cowie et al. 1996)
and analyze
the resolved pixel-by-pixel 4-colour data in constraining the star
formation history of each
galaxy and its physical sub-components? As most of the faint galaxies
are extraordinarily
blue, the HDF colours are primarily sensitive to relative main sequence
ages, modulo
small uncertainties in dust, the IMF and metallicity. These effects
would be worrisome
if absolute ages were sought, but not if the goal is to examine the
relative spread of
burst ages ( t / t)
across a galaxy in relation to its constituent spatial components. The
technique can be tested for intermediate redshift spirals and
ellipticals where sensible
results emerge for the bulge and disk components and so, in
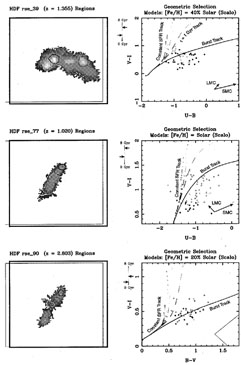
Fig. 6, we illustrate how this
method can be applied to the enigmatic high z irregulars and
so-called 'chain galaxies.'
Our resolved photometric analysis determines that these systems are
consistent with star
formation progressing in distinct bursts occurring several hundred Myr
apart, as might be
expected if physically-independent young components are slowly
assembling into larger structures.

|
Figure 6. Resolved stellar populations for 3 high redshift HDF galaxies from the forthcoming study of Abraham et al. (for a preliminary discussion see Abraham (1997)). The left panels show F814W images for 3 galaxies with Keck spectroscopy courtesy of Len Cowie. The right panels show the pixel-by-pixel HDF colours grouped in physically-distinct regions within each image as indicated by the colour scheme in the left hand panels. Model tracks show evolutionary changes expected for various stellar histories according to the cosmic clock in the vertical scale. The analysis suggest these three galaxies assembled from physically and temporally-distinct stellar components. |
Clearly this technique has limitations in terms of the history accessible when using optical data at high z, but the benefit of extending this kind of study to include NICMOS K-band features sensitive to the mass of the incoming components would be considerable, as would the possibility of using GEMINI's integral field unit spectrographs to obtain the associated dynamical data. Clearly this is a tough observational project but I believe we should now complete the logical progression that has delineated this subject observationally over the past two decades: from integrated photometry (counts) and spectroscopy (redshift surveys) through to HST resolved imaging (MDS, HDF) to IFU-based spectroscopy. Such exciting datasets we can fully expect to come shortly. They will demand equal progress in theoretical modeling which will have to become more realistic to give physical insight into the evolutionary processes which are clearly occurring.