

3.1 Substructure in Clusters
One of the indicators of the dynamical state of a cluster is the degree of substructure as demonstrated by either the galaxy or the gas distribution. The X-ray observations have been found to be particularly suited to studies of the structure of the cluster potential. Figure 5 shows X-ray isointensity contours of four clusters - SC0627-54, A98, A1750, and A115 - each of which had been selected optically as a single system.
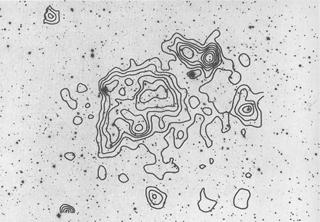
The figure shows that each cluster consists of two separate structures. Subsequent detailed optical observations of the galaxy distributions confirm the bimodal nature of these clusters and for A115 suggest a third component (Beers, Huchra, and Geller 1983). Furthermore, each of the pair of subclusters have redshifts consistent with being members of a single collapsing system (see Forman et al. 1981 and Henry et al. 1981). Beers, Geller, and Huchra (1982) have analyzed A98 in detail using extensive spectroscopic observations and argued that the two subclusters are presently falling toward each other and will merge on a time scale of roughly 109 years. Other X-ray cluster images show still richer substructure. For example, A514, shown in Figure 6, has at least three mass condensations.

|
Figure 6. The X-ray iso-intensity contours
(3, 5, 7, 9, 11, 14, 17 |
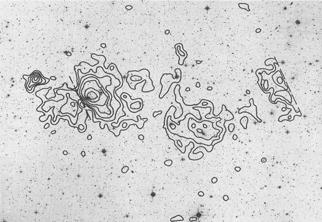
The separate structures have luminosities ranging from 6 x 1042 to 6 x 1043 ergs sec-1 (Jones and Forman 1989a). Another cluster with considerable substructure is A3562 (z ~ 0.05) from the extended Abell Catalog (Abell, Corwin, and Olowin 1989). As Figure 7 shows, this cluster, selected optically as a single structure, has three distinct condensations each with X-ray luminosities of about 5 x 1043 ergs sec-1 (within 0.25 Mpc of their respective centers). This system is particularly interesting since it lies at the center of a very rich supercluster in the direction of the Great Attractor (Scaramella et al. 1989).

|
Figure 7. An X-ray isointensity contour map of the Einstein IPC image around A3562 is superposed on an optical photograph. This 6500 second observation shows three extended regions of cluster-like X-ray emission. The eastern most region is coincident with A3562. Note that it appears as two separate sections because of the obscuration of the IPC window support structure (dashed line). The remaining two cluster-like structures were not distinguished optically although they clearly represent major concentrations of matter. The cluster to the west lies on the edge of the IPC field of view. The X-ray observations can provide a complementary view of large scale structures and more readily distinguish substructure in the gravitational potential than do the optical observations. |