


5.1. Global statistical properties
In Figure 4 we show the frequency histograms of
the asymptotic FUV and
NUV AB magnitudes, FUV luminosity and (FUV-NUV) (both asymptotic and
at the D25 aperture) color.
Heckman et al. (2005)
have recently shown that galaxies with FUV luminosities brighter than
2 × 10¹⁰
L (7.6 ×
1036 W or MFUV = -19.87) (also known as
ultraviolet-luminous
galaxies or UVLGs) are extremely rare in our Local Universe. Their
comoving space density is only ~ 10-5 Mpc-3, i.e.
several hundred times lower than that of their z = 3
counterparts, the Lyman Break Galaxies (LBG). Indeed, only four galaxies
in the Atlas
(see Figure 4c) would be classified as UVLGs:
two AGN, NGC 7469 and
Mrk 501, and two actively star-forming interacting
systems, the Cartwheel (see e.g.
Amram et al. 1998)
and UGC 06697
(Gavazzi et al. 2001).
(7.6 ×
1036 W or MFUV = -19.87) (also known as
ultraviolet-luminous
galaxies or UVLGs) are extremely rare in our Local Universe. Their
comoving space density is only ~ 10-5 Mpc-3, i.e.
several hundred times lower than that of their z = 3
counterparts, the Lyman Break Galaxies (LBG). Indeed, only four galaxies
in the Atlas
(see Figure 4c) would be classified as UVLGs:
two AGN, NGC 7469 and
Mrk 501, and two actively star-forming interacting
systems, the Cartwheel (see e.g.
Amram et al. 1998)
and UGC 06697
(Gavazzi et al. 2001).
 |
Figure 4. UV properties of the galaxies in
the Atlas. a) Frequency
histogram of apparent asymptotic FUV magnitudes (AB scale). b)
Apparent asymptotic NUV magnitudes. c) FUV luminosity in Watts
computed as |
The color distribution of Figure 4d shows a
pronounced peak at
(FUV-NUV)  0.4 mag and a
long tail extending to very red
colors. As we will show later, this red tail is, not unexpectedly,
mostly populated by elliptical galaxies of intermediate mass that show
little recent star formation activity and a weak UV-upturn (see
Boselli et al. 2005).
This figure also shows the distribution of
effective radii both in arcsec (Figure 4e) and
in kiloparsecs
(Figure 4f). The distribution of effective radii
is very similar for
the FUV and the NUV. Due to the limited spatial resolution of the
GALEX data we only computed the effective radius of galaxies for which
the semi-major axis
of the ellipse including 50 per cent of the light was larger than
6arcsec in radius. This fact, along with the lower limit in optical
diameter (1 arcmin) imposed by the completeness of the RC3, results
in a paucity of compact galaxies and a relatively narrow distribution
in apparent effective radius peaking at ~ 15 arcsec. The
distribution in physical size (Figure 4f), on
the other hand, is significantly wider with a peak around 5-6 kpc.
0.4 mag and a
long tail extending to very red
colors. As we will show later, this red tail is, not unexpectedly,
mostly populated by elliptical galaxies of intermediate mass that show
little recent star formation activity and a weak UV-upturn (see
Boselli et al. 2005).
This figure also shows the distribution of
effective radii both in arcsec (Figure 4e) and
in kiloparsecs
(Figure 4f). The distribution of effective radii
is very similar for
the FUV and the NUV. Due to the limited spatial resolution of the
GALEX data we only computed the effective radius of galaxies for which
the semi-major axis
of the ellipse including 50 per cent of the light was larger than
6arcsec in radius. This fact, along with the lower limit in optical
diameter (1 arcmin) imposed by the completeness of the RC3, results
in a paucity of compact galaxies and a relatively narrow distribution
in apparent effective radius peaking at ~ 15 arcsec. The
distribution in physical size (Figure 4f), on
the other hand, is significantly wider with a peak around 5-6 kpc.
The distributions of the concentration indices C31 and C42 (Figures 4h & 4i, respectively) are also very narrow with the galaxies being slightly more concentrated (i.e. larger values of C31 and C42) in the NUV than in the FUV (see Figures 4j & 4k for a comparison between the value of these indices in the two bands). This is probably a consequence of the fact that in the NUV a significant fraction of the light in spiral galaxies still arises from within the bulge component, while in the FUV this contribution is in many cases negligible.
5.2. Properties by morphological type
The GALEX FUV and NUV observations presented here, along with the corresponding corollary data in the optical, NIR and FIR provides us with an unprecedented set of multiwavelength data for a large population of galaxies in the local Universe. One of the first questions that can be addressed using this sample concerns the relation between the qualitative (optical) morphology of these galaxies and more quantitative properties, such as colors, luminosities, total-infrared-to-UV ratios, etc. In Figure 5 we show the colors of the galaxies as a function of the blue-light morphological type as given by the RC3. Panels 5a & 5b show that although late-type spiral and irregular galaxies are somewhat bluer in (B - V) and (B - K) than ellipticals and early-type spirals, these colors are not unique to a given type. In particular, these colors cannot be used to unambiguously discriminate between different kinds of spiral galaxies nor even between elliptical/lenticular galaxies and spirals. As indicated by Roberts & Haynes (1994), the significant ovelap in (B - V) color between spiral galaxies of different types is mostly due to true variations in the optical colors and star-formation history of galaxies of same morphological type, not to misclassification or observational errors. The equivalent to the Panel 5b for late-type Virgo cluster galaxies was obtained by Boselli et al. (1997). These authors obtained a large overlap in (B - K) color between different morphological types as well.
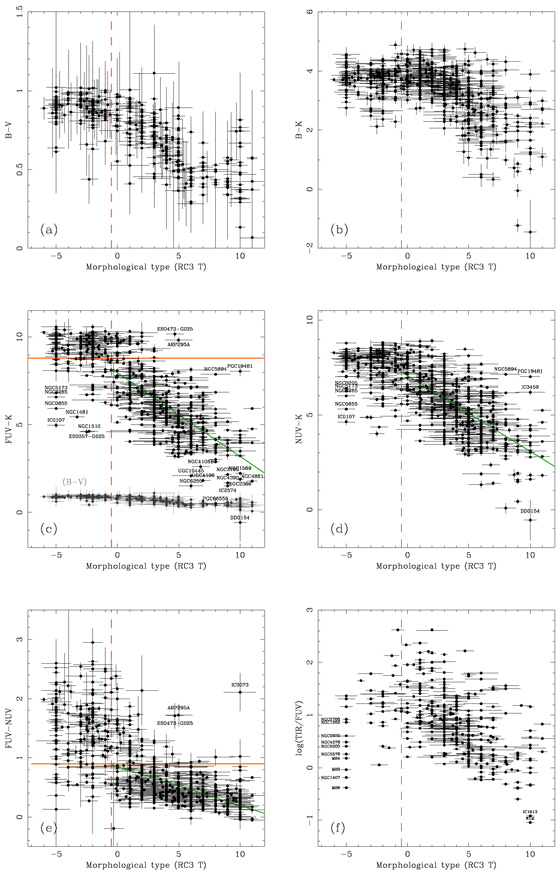 |
Figure 5. Variation in the observed colors
and total-infrared (TIR) to FUV ratio of the galaxies in the Atlas with
the morphological type (T). a) (B - V) versus the
morphological type for elliptical/lenticular (T < -0.5), spiral
(-0.5 |
However, thanks to the extreme sensitivity of the FUV data to the presence of very low levels of recent star formation activity, the use of the (FUV- K) color turns out to be a very powerful discriminant between quiescent elliptical and lenticular galaxies, and star-forming spirals. In particular, an observed (FUV- K) color of 8.8 mag provides an excellent discrimination point between these two groups (see Figure 5c). In this sense, of all the elliptical/lenticular galaxies in the Atlas with both FUV and K-band data available only 23% of them show a (FUV- K) color bluer than this threshold. It is worth noting that significant a fraction of these are known to host some residual star formation activity (e.g. NGC 3265, Condon, Cotton, & Broderick 2002 and NGC 0855, Wiklind, Combes, & Henkel 1995), or are low-luminosity ellipticals with obvious star formation activity like NGC 1510 (Marlowe, Meurer, & Heckman 1999). Spiral and irregular galaxies with (FUV- K) colors redder than this value only represent 9% of the total.
Although with significantly degraded discriminating capabilities compared to the (FUV- K) color, the (NUV- K) is also well correlated with the morpholotical type (see Figure 5d). The same can be said about the (FUV-NUV) color, where a cut-off at (FUV-NUV) = 0.9 mag provides a relatively clean separation of elliptical/lenticular galaxies from spirals (Figure 5e). The fraction of elliptical/lenticular galaxies with (FUV-NUV) color bluer than 0.9 mag (and both FUV and NUV magnitudes available) is 18% while the percentage of spiral and irregulars redder than this value is only 12%. Note that in this case the far-left lower corner of the diagram may be populated both by ellipticals with residual star formation and also by elliptical galaxies with a strong UV-upturn (Deharveng, Boselli, & Donas 2002 and references therein). The best linear fits derived for the correlation of observed colors with the morphological type for spirals and irregulars (types T > -0.5) are
 |
(3) (4) (5) |
These relations are shown in Figures 5c, 5d, & 5e. Note that although the r.m.s. of the fit for the (FUV-NUV) color is smaller than for (FUV- K) this is purely a consequence of the much smaller dynamic range of the (FUV-NUV) color (1 mag) compared with the (FUV - K) color (~ 6 mag) (see Figure 5c). The corresponding best fits in the type T versus color diagrams are (only galaxies with types T < 13 are considered)
 |
(6) (7) (8) |
These fits are valid only for colors (FUV - K) < 8.8 mag, (NUV - K) < 7.9 mag, and (FUV- NUV) < 0.9 mag, respectively.
Finally, in Figure 5f we compare the
total-infrared (TIR hereafter) to
FUV ratio with the morphological type of the galaxies in the
Atlas. The TIR flux was derived using the parameterization of the
TIR-to-FIR ratio given by
Dale et al. (2001),
where FIR is computed from the 60 and 100 micron IRAS fluxes as in
Lonsdale et al. (1985).
The flux in the FUV is expressed in units of
 F (see
Buat et al. 2005).
In the case of spiral and irregular
galaxies, for which both the UV and infrared emission are ultimately
due to young massive stars, this ratio provides a well defined
estimator of the dust attenuation in the UV
(Buat et al. 2005;
Cortese et al. 2006).
Given the sensitivity limits of the IRAS
catalog and the low dust content of elliptical and lenticular galaxies
the number of these galaxies detected in both the 60 and 100micron
IRAS bands is only 49 out of the 225 ellipticals in the
Atlas. Figure 5f shows that late-type spirals
and irregulars tend to
show, on average, a lower TIR-to-FUV ratio and consequently smaller
attenuation in the UV than that derived for early-type spirals.
F (see
Buat et al. 2005).
In the case of spiral and irregular
galaxies, for which both the UV and infrared emission are ultimately
due to young massive stars, this ratio provides a well defined
estimator of the dust attenuation in the UV
(Buat et al. 2005;
Cortese et al. 2006).
Given the sensitivity limits of the IRAS
catalog and the low dust content of elliptical and lenticular galaxies
the number of these galaxies detected in both the 60 and 100micron
IRAS bands is only 49 out of the 225 ellipticals in the
Atlas. Figure 5f shows that late-type spirals
and irregulars tend to
show, on average, a lower TIR-to-FUV ratio and consequently smaller
attenuation in the UV than that derived for early-type spirals.
5.3. Color-magnitude and color-color diagrams
Although morphology is certainly related with the way galaxies form and evolve, especially when the properties of elliptical and spiral galaxies are compared, the luminosity and even more the mass (either the luminous or total mass) is thought to be the main driving force of the evolution of galaxies through the history of the Universe. In this sense, the analysis of color-magnitude diagrams (CMD) has traditionally provided a fundamental tool for understanting galaxy evolution.
Figures 6a and 6b show the CMD in (FUV - K) - MK and (NUV - K) - MK. At the top of these diagrams we find the `red sequence' populated primarily by elliptical and lenticular galaxies (dots). In the case of the (NUV - K) - MK CMD the red sequence shows a clear slope with lower luminosity galaxies showing bluer colors, especially below MK > -23 mag. A similar behavior is seen when optical or optical-NIR colors are used, both locally and at high redshift (Gladders & Yee 2005). This is commonly explained in terms of lower metal abundances (thus bluer colors) of the stellar populations in low mass ellipticals as compared to the more massive (higher metallicity) systems (Gladders et al. 1998 and references therein). In the case of the (FUV - K) - MK CMD, on the other hand, the distribution of the (FUV - K) color is rather flat over a range of almost 7 mag in absolute magnitude. The explanation for this different behavior can be found in Figure 6c. Here the (FUV-NUV) gets systematically redder as we move to lower luminosities. This is opposite to what is seen in any other colors and it is probably a consequence of a weaker UV-upturn in intermediate-mass ellipticals than in the most luminous and massive ones (see Boselli et al. 2005). Note that, due to the stronger UV-upturn towards the centers of elliptical galaxies (Ohl et al. 1998; Rhee et al. 2006, in preparation), the asymptotic colors do not probably show the full strength of the UV-upturn in the way aperture colors like those obtained from the analysis of IUE spectra do (Burstein et al. 1988).
 |
Figure 6. Color-magnitude diagrams (CMD) of
the Atlas galaxies.
Red dots are elliptical/lenticular galaxies, dark green triangles are
early-type spirals (T < 5), light green triangles are late-type
spirals (T |
Dwarf elliptical galaxies have K-band absolute magnitudes that are typically fainter than MK = -21 mag. Unfortunately, not many of these more extreme low-luminosity ellipticals are found in the Atlas. This is mainly because dwarf ellipticals in Virgo (where most of the studies on dE have been carried out to date) are typically smaller than 1arcmin in size placing them outside the selection limit imposed on the Atlas. Nevertheless, a recent study by Boselli et al. (2005) suggests that residual star formation might play a leading role in the interpretation of the UV emission from dE galaxies, which would explain their behavior in the CMD (i.e. similar to the behavior seen in low mass star-forming galaxies). The tendency for the most luminous ellipticals to show bluer (FUV-NUV) colors is even more clear when the FUV-band absolute magnitude is considered (see Figure 6e). However, if the B-band luminosity is used, the (FUV-NUV) color seems to be independent of luminosity.
Regarding the properties of spiral (triangles) and irregular galaxies (asterisks) in these plots we find that the majority of these galaxies are concentrated in a `blue sequence' with high-luminosity spirals (which also tend to be of earlier types) being redder than low-mass spirals and irregular/compact galaxies. This is true for all the observed (FUV - K), (NUV - K), and (FUV-NUV) colors (Figures 6a, 6b, & 6c). There are two mechanisms that may lead to the observed behavior. First, low luminosity galaxies are known to have lower metallicities (both in the stars and in the gas) than more luminous ones (Salzer et al. 2005 and references therein). This implies that the amount of dust (and reddening of the colors) in low-luminosity galaxies should be lower than in luminous ones.
The (FUV-K) [(NUV-K)] color is found to span a range of 5 mag [4 mag] in spiral and irregular galaxies of different types and luminosities with a mean value of 5.9 mag [5.4 mag]. The corresponding 1-sigma of the distribution is 1.7 mag [1.4 mag]. On the other hand, the dispersion in the AFUV [ANUV] derived is only 1.0 mag [0.8 mag] (see below). Since the AFUV / (AFUV-AK) [ANUV / (ANUV-AK)] total-to-selective extinction ratio is always between 1.0 and 1.1 for any attenuation law considered, dust extinction alone is not able to explain the dispersion in the observed (FUV-K) [(NUV-K)] color neither its dependence on luminosity or morphological type.
It is now widely accepted that the star formation history of galaxies
depends strongly on their stellar or total mass. Low mass galaxies
show relatively flat star formation histories, while more massive
systems have shorter timescales of formation (e.g.
Gavazzi et al. 1996,
2002;
Gavazzi & Scodeggio
1996;
Boselli et al. 2001).
By virtue of this phenomenon, sometimes simplistically referred to as
'down-sizing' (see
Cowie et al. 1996),
low-mass galaxies should be
on average bluer in these colors than more massive galaxies. In this
sense, we know that the typical stellar mass of a star-forming galaxy
in the local Universe is ~ 1.3 × 10¹⁰
M
(Pérez-González
et al. 2003;
Gil de Paz et al. 2000),
i.e. more than five times less massive than a L*
galaxy in the NIR
(Cole et al. 2001;
Kauffmann et al. 2003).
Since we have information about the TIR emission for a large fraction of these galaxies we can compute the attenuation in the FUV and NUV from the observed TIR-to-FUV ratio using the recipes published by Buat et al. (2005). The mean and 1-sigma FUV [NUV] attenuation of the sample of spiral and irregular galaxies in the Atlas is 1.8 ± 1.0 mag [1.3 ± 0.8 mag]. The extinction-corrected (FUV-NUV) color is plotted in Figure 6d as a function of the K-band absolute magnitude. The solid (dashed) line shown in this plot represents the best weighted (non-weighted) fit to the data
 |
(9) (10) |
Although there is a small tendency for the galaxies to show redder UV
colors at lower luminosities and later types, we do not exclude the
possibility that the intrinsic (FUV-NUV) color derived in this way
is independent of luminosity with an average value of
(FUV-NUV)0 = 0.025 ± 0.049 mag (i.e.
 GLX,0
= -1.94 ± 0.11; see
Kong et al. 2004).
We should note here that the
measurements of the extinction in the FUV and NUV from which this
intrinsic (FUV-NUV) color is derived are not fully independent since
both are obtained by comparing the corresponding observed FUV and NUV
flux with the same total-infrared emission
(Buat et al. 2005).
Consequently, there might be some additional weak dependency of
the intrinsic (FUV-NUV) color with the luminosity that could be
identified by analyzing both the detailed star formation history and
dust properties (composition, geometry, temperature distribution) of
individual galaxies.
GLX,0
= -1.94 ± 0.11; see
Kong et al. 2004).
We should note here that the
measurements of the extinction in the FUV and NUV from which this
intrinsic (FUV-NUV) color is derived are not fully independent since
both are obtained by comparing the corresponding observed FUV and NUV
flux with the same total-infrared emission
(Buat et al. 2005).
Consequently, there might be some additional weak dependency of
the intrinsic (FUV-NUV) color with the luminosity that could be
identified by analyzing both the detailed star formation history and
dust properties (composition, geometry, temperature distribution) of
individual galaxies.
Figure 6e shows that the most luminous galaxies in the FUV are spirals (both early- and late-type ones). In the optical (Figure 6f) and NIR (Figure 6c), on the other hand, the bright end of the luminosity function is populated by both elliptical and spiral galaxies. It is also worth noting that the galaxies in the bright end of the FUV luminosity function show a very narrow dispersion in the observed (FUV-NUV) color, that results in a very similar shape for the bright end of the FUV and the NUV local luminosity functions (Wyder et al. 2005).
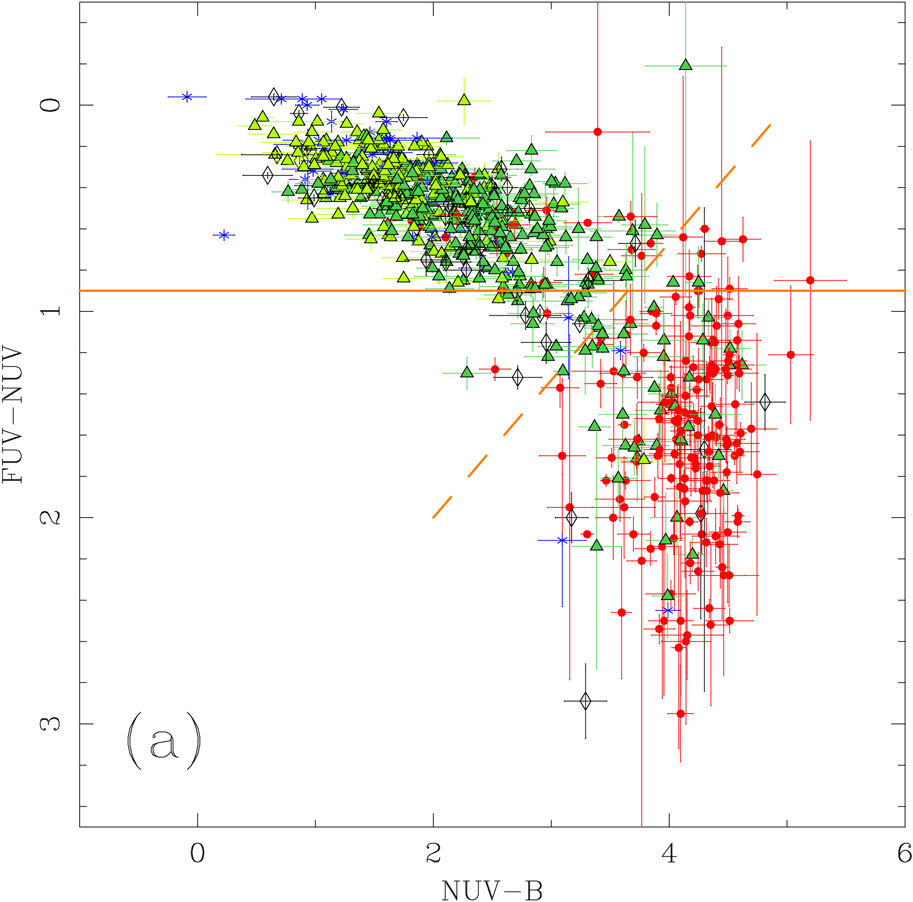
In Figure 7a we analyze the (FUV-NUV)-(NUV- B) color-color diagram of the galaxies in the Atlas. It is remarkable the relatively narrow strip of this diagram where the galaxies are located. In the case of the spiral galaxies this is due in part to the well-known degeneracy in these colors between dust extinction and star formation history (see e.g. Gil de Paz & Madore 2002). The ellipticals show a very narrow range in (NUV - B) color but a wide range of (FUV-NUV) colors, probably due to differences in the strength of the UV-upturn from galaxy to galaxy. In the (FUV-NUV) - (NUV - K) color diagram (Figure 7b) we find that ellipticals with redder (NUV - K) color tend to show bluer (FUV-NUV) colors. This is again a consequence of the weaker UV-upturn present in optically blue, intermediate-mass ellipticals. The combination of the (FUV-NUV) color with either the (NUV - B) or the (NUV - K) color clearly improves the discrimination between elliptical/lenticular galaxies and spirals (see broken lines in Figures 7a & 7b). In the case of the (FUV-NUV) -(NUV - B) color-color diagram the origin {destination} of the cut-off line is [(FUV-NUV),(NUV - B)] = [2.0,2.0] {5.0,0.0}. For the (FUV-NUV)-(NUV - K) color-color diagram the corresponding origin {destination} of the cut-off line is [(FUV-NUV),(NUV - K)] = [5.0,1.7] {9.5,0.4}.
 |
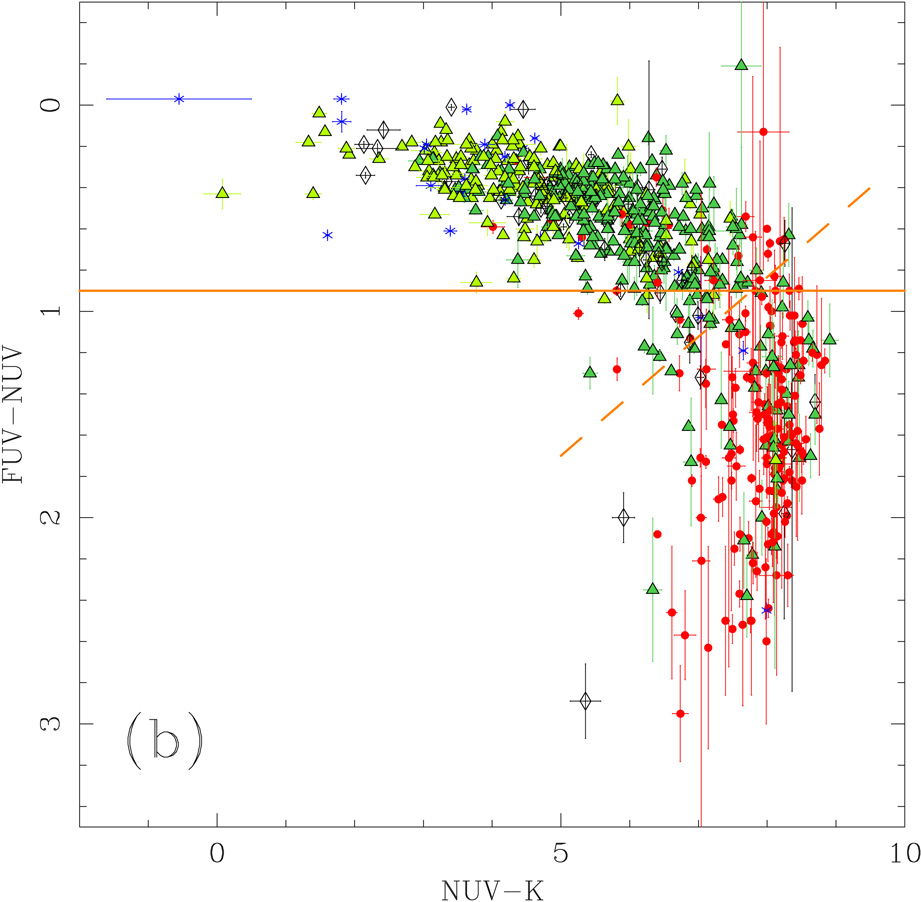 |
Figure 7. Color-color diagrams of the galaxies in the Atlas. a) (FUV-NUV)-(NUV- B) color-color diagram. b) (FUV-NUV)-(NUV- K) color-color diagram. Symbols have the same meaning as in Figure 6. Lines in this plot represent various criteria proposed to separate elliptical/lenticular galaxies from spirals (see text for details). Note that, in order to keep with the stellar convention, the (FUV-NUV) axis has been flipped and red (FUV-NUV) colors are now plotted at the bottom of the figure. |
|
5.4. Dust extinction and the
IRX-
relation
The relation found by
Heckman et
al. (1995) and
Meurer et al. (1995,
1999)
between the TIR-to-FUV ratio and the slope of the UV
spectrum in starburst galaxies
(IRX-
relationship; see also
Seibert et al. 2005)
can be used in principle to estimate the dust
extinction in galaxies even if FIR data are not available. Some recent
works have claimed that this relationship is valid only when applied
to UV-selected starburst galaxies but not in the case of
infrared-bright objects like the luminous/ultra-luminous infrared
galaxies (LIRGs/ULIRGs;
Goldader et al. 2002)
or even for normal spiral or irregular galaxies (see
Bell et al. 2002
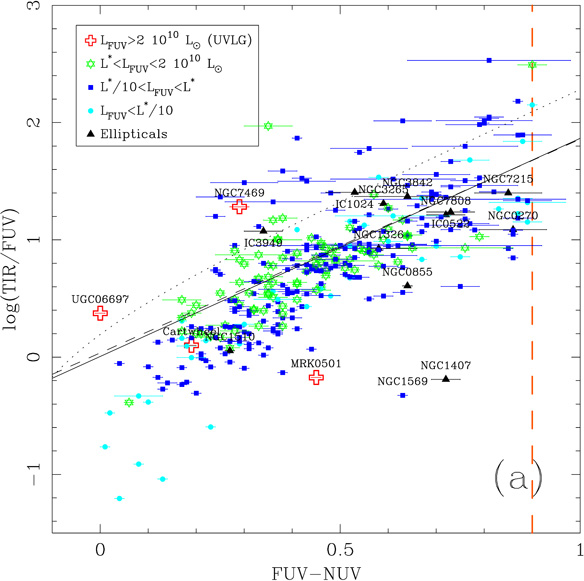
for results on the LMC). In Figure 8a we compare
the TIR-to-FUV ratio with the observed (FUV-NUV) color, which is
equivalent to the slope of the UV continuum (see
Kong et al. 2004).
Here we have only plotted galaxies
with observed (FUV-NUV) color bluer than 0.9 mag. This criterion
guarantees that the vast majority of the objects considered are either
spiral or irregular galaxies. The dotted line represents the
IRX-
relation given by
Meurer et al. (1999).
This figure demonstrates that the slope of the UV is indeed well
correlated with
the TIR-to-FUV and can be used to estimate (at least in a statistical
way) the dust extinction in nearby galaxies. Similar results are found
by Cortese et
al. (2006)
using a volume-limited optically-selected
sample of galaxies in nearby clusters.
 |
 |
Figure 8. a) IRX-beta relation. The vertical long dashed-line represents the cutoff in (FUV-NUV) color used to select the sub-sample of galaxies used to study the relation between the TIR-to-FUV ratio and the slope of the UV. This selection criterion guarantees that in the galaxies considered both the infrared and the UV emission are in the most part associated with the presence of recent star formation activity. The dotted line represents the relation derived by using a sample of starburst galaxies (Kong et al. 2004; Meurer et al. 1999). The best fit to the whole set of data is shown by a solid line. The best fit obtained excluding the lowest luminosity galaxies (dots) is shown by a dashed line. Symbols are coded by UV luminosity. Galaxies with higher UV luminosities (green stars) seem to be located somewhat closer to the relation derived for starburst galaxies that fainter objects (blue squares). Triangles correspond to the elliptical galaxies in the sample. Note that most of the ellipticals with (FUV-NUV) < 0.9 are known to have some degree of residual star formation. b) AFUV versus (FUV-NUV)-0.025. The latter term is equivalent to AFUV-ANUV if an intrinsic (FUV-NUV) = 0.025 mag is assumed for all star-forming galaxies in the sample (see Section 5.3). The lines drawn correspond to the total-to-selective extinction in the UV expected for different extinction laws (MW, solid line; LMC 30 Doradus, dotted line; SMC Wing, dashed line; SMC Bar, dot-dot-dot-dashed line) and the attenuation law of Calzetti et al. (1994, dot-dashed line). The RV values adopted for each of these laws are given in the text. Note that the inclusion of scattering would result in steeper relations between AFUV and AFUV-ANUV than those shown here. Therefore, an attenuation law based on the SMC Bar extinction law seems to be favored by these results. High-UV-luminosity galaxies are still adequately represented by the Calzetti attenuation law. |
|
The solid line in Figure 8a represents the best linear fit to the data. The dashed line is the same but excluding objects with luminosities below 0.1 × L* (M* FUV = -18.12; Wyder et al. 2005), for which the relation begins to depart from linearity. The results of these fits are
 |
(11) (12) |
Note that our sample suffers of a small deficiency of low-luminosity
spirals. This fact might have an impact on the best-fit
IRX-
relationship derived above.
Cortese et al. (2006)
have recently
proposed a set of recipes that can be used to estimate the TIR-to-FUV
ratio in star-forming galaxies using not only the (FUV-NUV) color
but other parameters such as the oxygen abundance, the luminosity, the
mean surface brightness, etc.
The majority of the objects in Figure 8a are found below the relationship defined for starburst galaxies. It is worth noting that objects with higher UV luminosity, some of them starburst galaxies, seem to fall closer on average [at least in the region with (FUV-NUV) < 0.6 mag] to Meurer et al.'s relation than lower luminosity galaxies. According to Kong et al. (2004) the offset between normal galaxies and starbursts is primarily due to a lower ratio of present to past-averaged SFR in normal galaxies. However, the results obtained by Seibert et al. (2005) and Cortese et al. (2006) using GALEX data of nearby galaxies do not support this idea. These recent studies suggest that this offset might be due instead to a different geometry of the dust in normal galaxies compared with starbursts or, alternatively, to aperture effects present in the IUE dataset used by Meurer et al. (1999).
The fact that we find such a good correlation between the TIR-to-FUV ratio and the (FUV-NUV) color and that the intrinsic (FUV-NUV) color seems to be rather constant for spiral and irregular galaxies suggests that the attenuation law in the UV for these galaxies is different from a pure Galactic extinction law. In the case of the Milky Way the extinction law shows a bump at 2175Å that would result in a similar extinction in both bands, AFUV = 7.9 × E(B - V) and ANUV = 8.0 × E(B - V) (Bianchi et al. 2005). Thus, the observed trend in the (FUV-NUV) color with the TIR-to-FUV ratio is most probably due to a different extinction law since scattering, either for a shell or clumpy dust geometry, would result in an even lower FUV attenuation (compared with the NUV) than that expected from the Galactic extinction law alone (see e.g. Roussel et al. 2005). The SMC Bar or 30 Doradus extinction laws and the attenuation law proposed by Calzetti et al. (1994) all show a weak 2175Å feature and, especially in the case of the SMC Bar extinction law, a relatively steep FUV rise. In this sense, despite of including scattering, the FUV rise of the Calzetti law is apparently too modest to reproduce the dependence between AFUV and AFUV-ANUV followed by the majority of the galaxies in our sample (see Figure 8b) . Thus, although the Calzetti law, originally built for UV-bright starburst galaxies, still provides an adequate approximation to the relation between AFUV and AFUV-ANUV for galaxies with UV luminosities above L*, an attenuation law based on the SMC-Bar extinction law is favored for the bulk of the galaxies in this Atlas.
We cannot exclude, however, that the FUV emission might be arising from young stars more deeply embedded in their parent molecular clouds than those responsible for the NUV emission. If that is the case, the differential extinction between the FUV and NUV emitting sources would lead to an artificial FUV rise in the global attenuation law even if the extinction law is rather flat in the UV.
In this same sense, it is worth noting that here we are referring to the attenuation law of the dust associated with the regions responsible for the UV emission, which could be quite different from the law we would obtain from regions dominating the emission at other wavelengths and also different from the extinction law that would be derived from line-of-sight absorption studies of individual stars.
5.5. Structural properties and UV morphology
Concentration indices have been commonly used in the past to infer the morphological types of barely resolved intermediate redshift galaxies found in HST images (see e.g. Abraham et al. 1996). One of the problems associated with these studies is the fact that in many cases the concentration indices derived for the high-redshift galaxies are measured in the rest-frame UV while the local reference samples are usually observed in the optical (Bershady, Jangren, & Conselice 2000). In this sense, it is important to know the structural parameters in the UV of a sample of well-known nearby galaxies, like the one collected for this Atlas. Concentration indices C31 and C42 are provided in Table 3. The number of objects with these indices is small because we only computed the C31 (C42) concentration index for those galaxies whose radius containing 25% (20%) of the light was larger than 6arcsec. The same criterion applies to the effective radius, where the radius containing 50% of the light was imposed to be larger than 6arcsec in order for it to be measured.
In Figure 9 we compare the concentration index C42 with the (FUV- K) color. As we commented in Section 5.2 this color discriminates very well between elliptical and spiral galaxies and also between spiral galaxies of different types (see Section 5.2). This figure shows that the C42 index improves the discrimination between ellipticals (dots) and lenticulars (open circles) and also between these and early-type spirals (open triangles). Joe et al. (2006, in preparation) have recently carried out a more detail study of the structural properties (including both concentration and asymmetry parameters) of nearby galaxies in the UV using the same sample presented in this Atlas.
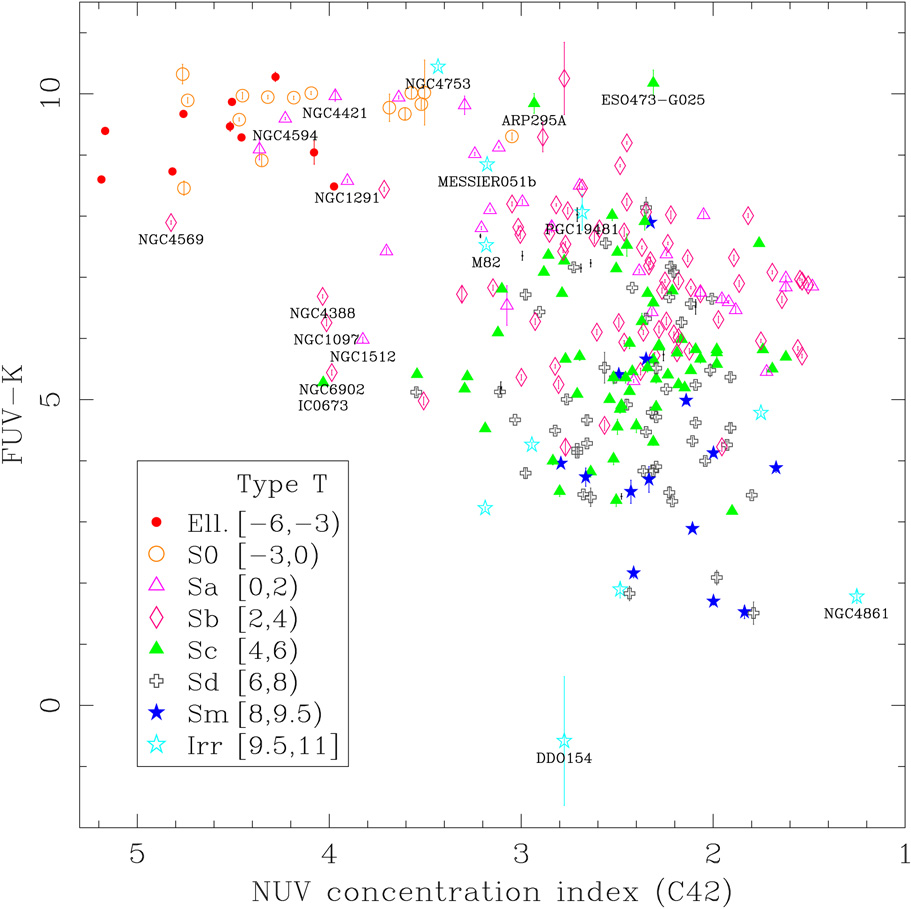 |
Figure 9. (FUV- K) color versus the concentration index C42 in the NUV. Symbols are coded by morphological type. Although the galaxies are better segregated in (FUV - K) color than in concentration index, the value of C42 can be used improve to the discrimination between ellipticals and lenticulars and between these and some early-type spirals. |
Regarding the morphological classification of the UV surface-brightness profiles we first notice a large variety of morphologies even within each of the classes defined in Section 4.4. This is partly a consequence of the high sensitivity of the UV to the recent star formation which results in the presence of structures having relatively short evolutionary time-scales that might dominate the UV profiles but that are not as obvious in the optical or NIR profiles. There is also the difficulty of dealing with degeneracies between some morphological classes. In this sense, some of the Blue Compact Dwarf galaxies in the sample could be easily classified as having ER or EV profiles. Also, some of the profiles inspected could be either classified as EEh or Ed. Despite of these issues we successfully classify the profiles of 970 of the 1034 galaxy in the Atlas. Moreover, we find that most of the galaxies (615 out of 970) have UV profiles that can be grouped in three main classes: (1) profiles that can be reproduced entirely by a de Vaucouleurs law (class VV), (2) pure exponential profiles (class EE), (3) profiles with an exponential component in the outer region and significant flattening in the inner region (EF and Ef classes). Only 19 galaxies were classified as EV class, despite being the dominant morphology in the optical and near-infrared profiles of spiral galaxies.
This paucity of EV profiles seems to be due, at least in the case of late type spirals, to the fact that even in the central regions the bulge is much fainter than the disk, which results in these galaxias being classified as having type EE or EF/Ef profiles (e.g. NGC 0628, M 33, NGC 1042, NGC 2403). In early-type spirals, like the Sb galaxies NGC 0986, M 31, M 81, M 95, the bulge is dominant only in the nucleus of the galaxy where is also commonly found associated with a flattening or decrease in the surface brightness of the disk toward the center. Because of the small spatial extension of these bulges in the UV surface brightness profiles Sb galaxies get usually classified as EFn, VFn, or EDn. Only lenticulars (e.g. NGC 1387, NGC 1546, NGC 4310, NGC 4477, NGC 6945, NGC 7252, M 86), intermediate S0/a (NGC 2681, NGC 3816, NGC 3885, IC 0796), or very early-type spirals like the Sa galaxies NGC 1022, NGC 2798, NGC 4314, or NGC 4491, are sometimes best classified as having EV-type UV profiles. This is true for both UV bands although it is more frequent in the case of the NUV profile.
In Figure 10 we plot the distribution of galaxies classified within each of these groups: de Vaucouleurs profiles (v), pure exponential profiles (e), and flattened exponential profiles (f); in the (FUV - K) versus morphological type diagram. Again, the morphological types used are those published in the RC3. In the light of this figure it is fair to say that the majority of the elliptical galaxies in the Atlas follow a de Vaucouleurs profile in the UV, like is the case of the optical and NIR profiles of luminous elliptical galaxies. Note that because of our selection limits a small number of dwarf elliptical galaxies (which commonly show exponential light profiles in the optical) is expected to be found in this Atlas. A few v-type galaxies classified morphologically as late T-type objects are found to be well-known Blue Compact Dwarf (BCD) galaxies: NGC 1569, NGC 3125, NGC 5253, NGC 6789, UGC 05720 (Haro 2). See Doublier et al. (1997, 1999) for some other examples of BCD galaxies with R1/4 profiles in the optical.
 |
Figure 10. a) (FUV- K) color versus the morphological type. The symbols are coded by letters that represent the morphology of their UV profiles: v for galaxies following a de Vaucouleurs R1/4 profile, e for galaxies with pure exponential profiles, and f for galaxies with exponential profiles in the outer regions and a flattened profile inside. b) Morphological-type distribution for each class of UV profile. |
Regarding the distribution of the other two types of profiles we point out that while galaxies with pure exponential profiles (a total of 173) are widely distributed in morphological type and color, galaxies with flattened exponential profiles (269) have, in the majority of the cases, morphological types T in the range 2 < T < 8, i.e. they are truly spiral galaxies. In order to explain this behavior is necessary to understand first what is the mechanism(s) behind the flattening of the UV profiles.
In the spectro-photometric models of the evolution of disk galaxies of Boissier & Prantzos (2000; see also Boissier 2000), a similar flattening in blue bands is obtained. The main reason for it is that the rate the stars formed (i.e. SFR) in the inner disk has been higher than the infall of gas, leading to a progressive consumption of the gas in these regions. In the outer parts, however, star formation is less efficient and infall proceeds on longer timescales. As a result, the gas reservoir of the outer disk is not exhausted, and the shape of the exponential profile is preserved (in adition, an extinction gradient could enhance the difference between the inner regions, metal and dust rich, and outer regions suffering low metallicity and low extinction).
The dependence of the degree of flattening with the morphological type found, with most galaxies showing flattened-exponential profiles having types Sab-Sdm, is probably a consequence of the fact that (1) early-type galaxies have already consumed the majority of their gas at all radii, due to a high global star formation efficiency and low current infall, and (2) late-type spirals, because of their current large supply of gas and infall, still have enough gas to prevent its consumption at all radii. Note also that in some very early type spirals (S0/a and Sa types) the presence or a relatively bright bulge might also difficult the detection of any flattening in the inner-disk profile.
The models referred above use as parameters the circular velocity (i.e. total mass), and the spin parameter (i.e. angular momentum). For a fixed spin parameter, the degree of flatenning should depend on mass since e.g. the infall time-scale depends on the mass. Indeed, at very low mass a modest flattening occurs, a more visible one at intermediate mass, and no flatenning again in very massive galaxies (where the gas has been consumed over the whole galaxy) (Boissier 2000). However, using the K-band absolute magnitude as a tracer of the total mass of the system we found no difference between the distribution of galaxies with or without flattening in their profiles. This disagreement with the naive expectation from the models could be linked to the existence of the second parameter (at fixed velocity, the flattening of the star formation rate is more noticeable for smaller spin parameters), or more fundamental differences between EF/Ef and EE galaxies, not yet included in models. A more direct measure of the total mass and spin parameter, or detailed modeling of these galaxies (or a sub-sample of them) could help us to understand what makes the EF/Ef galaxies different from the EE ones.
3 We have adopted RV = 3.1 for the Milky Way and LMC 30 Doradus extinction laws (Cardelli et al. 1989), RV = 4.05 for the Calzetti law (Calzetti et al. 2000), RV = 2.87 for the SMC Bar law (star AzV 398; Gordon & Clayton 1998), and RV = 2.66 for the SMC Wing law (star AzV 456; Gordon & Clayton 1998) Back.
 T < 9.5), and
irregular/compact galaxies (T
T < 9.5), and
irregular/compact galaxies (T
 9.5). The separation
between elliptical/lenticular and the rest is shown by a vertical
dashed line. b) The same for (B - K). Note the
small segregation in color between the different types when the
(B - V) or (B - K) colors are
used. c) The same for (FUV - K). The segregation between
ellipticals/lenticulars and spirals (horizontal solid line) and even
between different kind of spiral galaxies is now remarkable. For
comparison purposes we show (in the same scale) the range in (B
- V) color span by the galaxies in the sample (see panel
a). d) The same for (NUV - K). e) The same
for the (FUV-NUV) color. Note that FUV and NUV magnitudes are in AB
scale and optical and NIR magnitudes are in the Vega system. Green
lines represent the best linear fit to the data for types T = -0.5 or
later (i.e. spiral galaxies). f) The same for the TIR-to-FUV
ratio (see
9.5). The separation
between elliptical/lenticular and the rest is shown by a vertical
dashed line. b) The same for (B - K). Note the
small segregation in color between the different types when the
(B - V) or (B - K) colors are
used. c) The same for (FUV - K). The segregation between
ellipticals/lenticulars and spirals (horizontal solid line) and even
between different kind of spiral galaxies is now remarkable. For
comparison purposes we show (in the same scale) the range in (B
- V) color span by the galaxies in the sample (see panel
a). d) The same for (NUV - K). e) The same
for the (FUV-NUV) color. Note that FUV and NUV magnitudes are in AB
scale and optical and NIR magnitudes are in the Vega system. Green
lines represent the best linear fit to the data for types T = -0.5 or
later (i.e. spiral galaxies). f) The same for the TIR-to-FUV
ratio (see