

Historically, the measurement of the extragalactic gamma-ray background (GRB) was beset by great experimental difficulties. The high charged particle intensities in the balloon and space environment produce an intense background in gamma-ray instruments. Most early instruments had large fields of view and poor spatial resolution, which added complexities to the extraction of the diffuse extragalactic component. Data were obtained by many balloon- and satellite-borne instruments the last 30 years (Table 1), with a gradual improvement in the detector sensitivity achieved by larger detector sizes and better background-reduction techniques.
| Energy Band | Detector | Platform | Reference |
| 0.1-3 MeV | scintillator | Ranger 3 | Arnold et al. (1962) |
| 1-6 MeV | scintillator | ERS18 | Vette et al. (1970) |
| 1-5 MeV | scintillator | balloon | Vedrenne et al. (1971) |
| 0.1-8.5 MeV | scintillator | balloon | Daniel et al. (1972) |
| 0.03-4.1 MeV | scintillator | Kosmos | Mazets et al. (1975) |
| 0.1-4 MeV | scintillator | balloon | Fukuda et al. (1975) |
| 0.3-10 MeV | scintillator | Apollo | Trombka et al. (1977) |
| 2-10 MeV | Compton telescope | balloon | White et al. (1977) |
| 0.3-6 MeV | scintillator | balloon | Mandrou et al. (1979) |
| 3-60 keV | proportional counter | HEAO-1 A2 | Marshall et al. (1980) |
| 1.1-10 MeV | scintillator | balloon | Schönfelder et al. (1980) |
| 0.013-4.0 MeV | scintillator | HEAO-1 A4 | Gruber et al. (1985) |
| > 50 MeV | scintillator/Cerenkov | OSO-3 | Kraushaar et al. (1972) |
| 30-50 MeV | spark chamber | balloon | Pinkau et al. (1973) |
| 35-200 MeV | spark chamber | SAS-2 | Fichtel et al. (1978) |
| 4-100 MeV | spark chamber | balloon | Lavigne et al. (1982) |
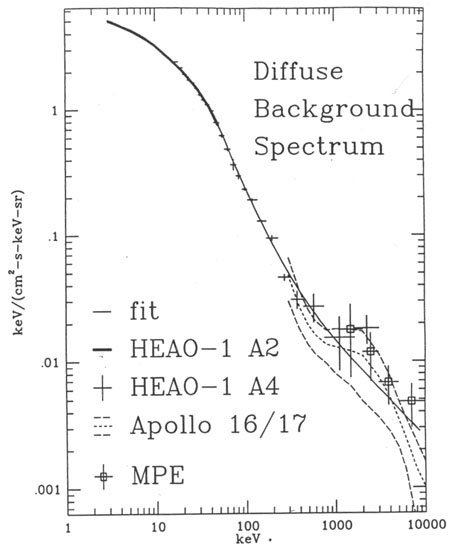
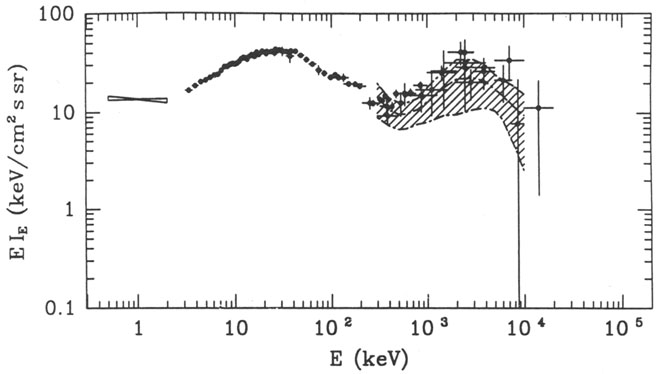
Though some of the earlier results gave only upper limits, we have now measured with reasonable accuracy the general form and magnitude of the GRB spectrum (Fig. 1). The low-energy portion (10 keV to 60 keV) of the GRB is characterized by a bremsstrahlung spectral form that can be approximated by a power-law segment of energy index ~ 0.4. The energy spectrum transitions to a power law of index ~ 1.6 above 60 keV, flattens to an index of ~ 0.7 around 1 MeV, then steepens again above several MeV to an index of ~ 1.7 that applies to energies well above 100 MeV. When plotted in intensity per logarithmic energy interval EIE (Fig. 2), the GRB spectrum exhibits two peaks, one at ~ 30 keV and the other at a few MeV (the MeV bump) (Zycki et al. 1993). There is still the lack of good measurements around the 10 to 30 MeV range due to the extraordinary high instrumental and atmospheric background in that regime. Results from the GRB observations by the Compton Gamma Ray Observatory (Compton) now in orbit will eventually fill in this range, and also vastly improve our knowledge at higher energies.
|
Figure 1. Energy spectrum of the diffuse extragalactic background (Gruber 1992). |
The GRB is of particular interest to cosmology because of the transparency of
the Universe to gamma rays back to redshifts of 100 or more. A determination of
the isotropy of the GRB can be a sensitive test of its cosmological
origin and a detailed study of the complete GRB spectrum and its spatial
fluctuations may provide
constraints to different cosmological models. There are two
possibilities for the origin
of the extragalactic GRB: (1) it is truly diffuse; and (2) it is the
integrated emission
of various distant unresolved gamma-ray sources. It may also be a
combination of
diffuse and point sources and may have different origins in different
portions of the
gamma-ray band. From below 10 MeV to 100 MeV, particle-antiparticle
annihilation,
bremsstrahlung and inverse Compton interactions between cosmic ray
particles and
lower-energy photons are the most likely gamma-ray production mechanisms. Above
100 MeV, the dominant process is
 ° decay from nucleon interactions.
|
Figure 2. The extragalactic background spectrum in intensity per logarithmic energy interval (adapted from Zycki et al. 1993). Circles correspond to the data points compiled by Gruber (1992) in Fig. 1. The elongated 0.5-2 keV error contour gives the ROSAT results (Hasinger 1992). The dashed region is the systematic error contour for the Apollo results, with the middle dot-dashed curve the best estimate of the spectrum. The 35-100 MeV error contour is the SAS-2 result from Fichtel et al. (1978). |
In this paper we summarize the state of our knowledge on the extragalactic GRB. We present the observations and their interpretations in two parts: (1) for energies from 0.1 to 10 MeV, and (2) for energies greater than 10 MeV. We then present the recent results from AGN observations by Compton and discuss their relevance to the GRB.