

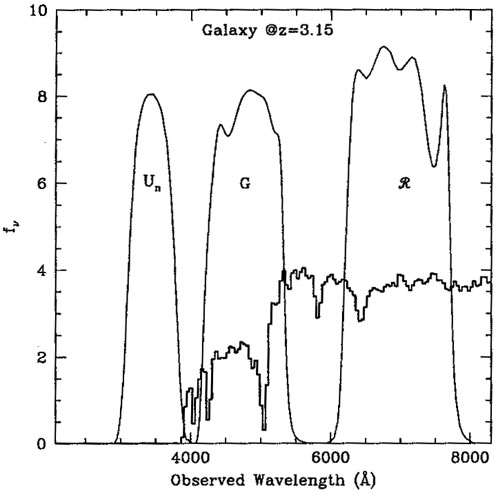
Exploiting the Lyman limit as a clear spectral feature to identify distant star-forming galaxies is hardly a new idea (e.g., Partridge & Peebles 1967). However, its implementation as an observational technique had to wait some 25 years or so, until detectors became sensitive enough (particularly in the U band) to make it practical with the available telescopes. Early observations that made use of deep CCD multi-band imaging to detect very high-redshift galaxies by their faintness in the U-band (see Figure 1) and constrain the abundance of galaxies at z > 3 were obtained by Guhathakurta et al. (1990) and Songaila et al. (1990). However, these works only set approximate upper limits to the surface density of these systems that turned out to be of rather limited use.
The first to exploit the Lyman-break technique to actually single out
very high-redshift
galaxies from the deep counts with relatively high efficiency were
Steidel & Hamilton
(1993).
Their first observations were obtained in rather poor seeing
conditions, were only
of modest depth (by modern standards), and covered a limited sky area to
produce a large
sample of robust candidates. Significantly deeper and better quality
data were obtained
in 1994 by Giavalisco et al. (unpublished), exploiting the image quality
available at the ESO New Technology Telescope; and by
Steidel et al. (1995)
at the William Herschel
Telescope. Later in 1995, additional deep images were obtained using the
200-inch Hale telescope and the large field-of-view COSMIC camera at its
prime focus. Although these
data resulted in relatively large samples of robust z ~ 3
Lyman-break galaxy candidates
(or U-band "dropouts" in the current parlance), they had to
remain such for one more
year. Due to the faintness of these candidates (typically

 24), 4-m class telescopes
are impractical to secure follow-up spectroscopy, and only redshifts of
unusual candidates were known by the end of 1995
(Giavalisco et al. 1994).
No definitive proof could be
provided for the existence of a population of galaxies at significant
redshifts without the
power of the 10-m class telescopes. Meanwhile, the HDF survey was being
conceived and designed.
24), 4-m class telescopes
are impractical to secure follow-up spectroscopy, and only redshifts of
unusual candidates were known by the end of 1995
(Giavalisco et al. 1994).
No definitive proof could be
provided for the existence of a population of galaxies at significant
redshifts without the
power of the 10-m class telescopes. Meanwhile, the HDF survey was being
conceived and designed.
|
|
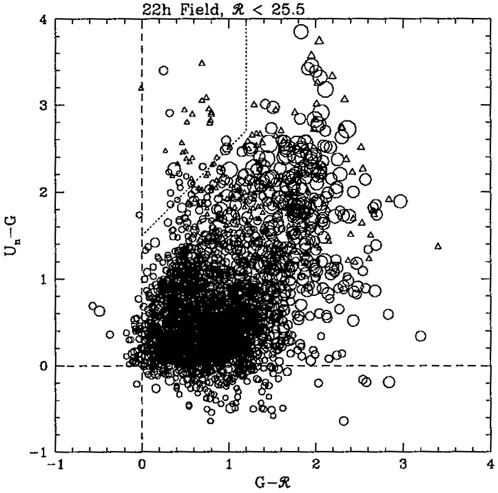
Figure 1. a) Color-selection of star-forming galaxies at z ~ 3. The transmittance of the UnGR filters are plotted. The histogram shows the UV SED of an unreddened continuously star-forming galaxy at z = 3.15, with the flux in an arbitrary scale. b) Color-color plot from deep UnGR imaging in the SSA22 field obtained at the 200-inch Palomar telescope with the COSMIC camera. Magnitudes are in the AB scale. The selection window for Lyman-break galaxies is marked by the dashed line. |
As Richard Ellis has recounted in this volume, there was initially little consensus on how to design what (as it was already clear) was to become a totally unprecedented survey of faint galaxies. The HDF would have detected galaxies too faint for spectroscopy to be practical in the foreseeable future. Deep imaging per se can only be of limited use if some information on the properties and the redshifts of the galaxies is not available. Plus, very deep HST images were already available in the archive (e.g., Dickinson et al. 1995) and simply improving their depth by a magnitude or so seemed only a relatively modest achievement, given the investment in telescope time. A multi-band survey that provided color information seemed the way to proceed if progress had to be made from deep imaging. But which passbands to use and how many? How to divide the available exposure time among the various, differently sensitive passbands to maximize color information and depth?
As we have seen, U-band dropouts were already relatively well known in 1995, with a sample that counted ~ 100 galaxy candidates at z ~ 3, some with HST morphologies as well. The consistency of such properties as luminosity distribution, surface density (Steidel et al. 1995), HST morphology (Giavalisco et al. 1994b; 1996a) and also limited spectroscopic information (Giavalisco et al. 1994a) seemed powerful arguments that suggested the existence of a new and totally unexplored population of galaxies whose redshifts were likely to be well in excess of z ~ 2. Thus, transporting to the HDF the same observational techniques adopted for the ground-based survey appeared a rather sensible choice. This would provide the HDF survey with color information and at the same time opened the possibility to directly study unprecedentedly distant galaxies at very faint fluxes. However, for this to be achieved, a significant amount of the available observing time had to be spent with the poorly efficient U passband (i.e., the F300W filter of the WFPC-2 collection). Although it was initially received as bizarre spending as much as half of the available exposure time imaging at wavelengths where the throughput of HST+WFPC-2 is very low, in the end considerations of practical nature (see Ferguson and Dickinson, this volume) made the decision of including the F300W filter in the HDF survey a rather easy one to take. Paradoxically, thanks to the low orbit of HST, the observing time that the Director of ST ScI allocated to the project could be effectively used imaging at wavelengths where the throughput is relatively high (i.e., F450W, F606W and F814W) and still get the precious F300W data essentially for free during the bright part of the orbit of the telescope. The HDF survey was made sensitive to the U-band dropouts.
In September 1995, we were able to follow up the NTT and Palomar samples of U-band dropouts with the Keck 10-meter telescope and LRIS spectrograph (Oke et al. 1995), confirming the existence of a massive population of star-forming galaxies at z ~ 3 (Steidel et al. 1996a). In December 1995, the HDF was successfully carried out, and by January 15, 1995 the first versions of the reduced images and of the source catalog were released to the community. During the same month, we obtained the first spectra of U-band dropouts selected from the HDF and confirmed their high redshifts (Steidel et al. 1996b). Other spectroscopic follow-ups of high-redshift candidates came shortly afterwards (Lowenthal et al. 1997).