


With 418 galaxies, the spectroscopic sample of Lyman-break galaxies is a rich source of information on the physical properties of star-forming galaxies at high redshifts. In addition to the optical data, the current sample also includes 5 near-IR (K-band) spectra obtained with the UKIRT telescope and the CGS4 spectrograph by Pettini et al. (1998, in preparation). In most cases, the S/N of the "discovery spectra," i.e., of the optical spectra obtained to secure the redshift of the galaxies, is relatively modest. Furthermore, the near-IR spectra, being obtained with a 4-m class telescope, have limited depth. Nevertheless, the amount of information contained in the data is sufficient to discuss important properties of the galaxies, as we shall now review.
3.1. The rest-frame UV spectra
At z ~ 3 the optical spectra sample the rest-frame far-UV radiation, approximately between 1000 and 2000 Å, carrying information on massive stars and on the interstellar gas. Overall, the spectra are all qualitatively similar and also bear a rather close resemblance with those of local star-forming galaxies, consistent with a relatively small dispersion of properties of the powering source and of the physical state of the interstellar absorbing medium. However, a closer inspection reveals differences, both between the Lyman-break galaxies themselves and with the local systems, particularly in the kinematics of the interstellar absorption lines and in the Lyman-alpha properties.
Figure 3 shows two examples of spectra that
illustrate the variety observed among the
Lyman-break galaxies along with the UV spectrum of
NGC 4214, a
Wolfe-Rayet galaxy observed with HST and the GHRS by
Leitherer et al. (1996).
As mentioned above, in
both cases the similarity between the spectra of the Lyman-break
galaxies and the local
galaxies is striking. In each case, the dominant characteristics of the
far-UV spectra are
(1) the flat continuum, whose spectral index is approximately
f ~
0 or slightly redder;
(2) the weak or absent Ly
~
0 or slightly redder;
(2) the weak or absent Ly emission, whose equivalent width is, in general, substantially
smaller than the predictions of the radiation-bound case-B recombination
theory; (3) the
strong interstellar absorption lines due to low-ionization species of C,
O, Si and Al; (4) the
prominent high-ionization stellar lines of HeII, CIV, SiIV, NV.
emission, whose equivalent width is, in general, substantially
smaller than the predictions of the radiation-bound case-B recombination
theory; (3) the
strong interstellar absorption lines due to low-ionization species of C,
O, Si and Al; (4) the
prominent high-ionization stellar lines of HeII, CIV, SiIV, NV.
|
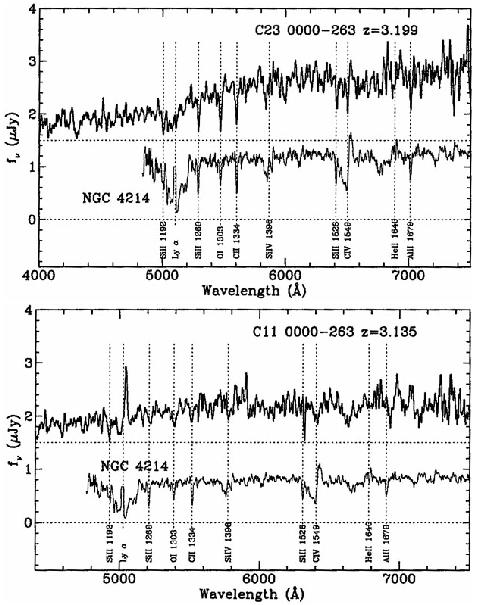
Figure 3. Two examples of Keck spectra of
Lyman-break galaxies plotted together with the
spectrum of a star-forming knot in the Wolfe-Rayet galaxy
NGC 4214
(Leitherer et al. 1996)
placed at the same redshift. The flux zero point of the high-z galaxies
is offset relative to the
zero point for the scaled spectrum of NGC 4214 (indicated with the
lower dotted line). Some of
the identified spectral features (both stellar and interstellar) have
been labeled for comparison.
These two cases give an idea of the variety of spectra observed among
the LLG population. In
the top panel Ly |
The two spectra, do show differences, however. The first has no detected
Ly emission
and has a broad absorption feature at its wavelength together with deep
and relatively
narrow interstellar absorption lines. The second, on the contrary, is
characterized by broader and shallower interstellar lines and by the
Ly emission line,
whose equivalent width, however, is modest,
 10 Å in the rest frame.
The S/N of these "discovery spectra" is insufficient to detect other
stellar features.
However, it is very interesting that whenever we could follow-up at
higher S/N and
dispersion some bright Lyman-break galaxy, we have always detected weak
stellar features such as the photospheric lines of
SV 1502 and
OIV1343, and
SiIII1417, characteristic of
O stars.
1502 and
OIV1343, and
SiIII1417, characteristic of
O stars.
The observed UV continua result from the integrated light of massive O
and early-B stars, A galaxy at z = 3 with
 ~ 24.5 has a far-UV
luminosity density
~ 24.5 has a far-UV
luminosity density
 ~ 1 x
1041
(2.5 x 1041) h-250 erg
s-1 Å-1 at
~ 1500 Å, with
q0 = 0.5 (0.1), respectively (we
will follow this convention throughout this paper, unless explicitly
indicated). This is
about three order of magnitudes the luminosity density of the brightest
local star clusters studied with HST (see, e.g.,
Leitherer et al. 1996).
Given the short life-time of O and
B stars, it is relatively straightforward to convert the observed
absolute UV luminosities
into instantaneous rates of star formation once an IMF has been
assumed. Adopting a
continuous star-formation activity with a Salpeter IMP from 0.1 to 100
M
~ 1 x
1041
(2.5 x 1041) h-250 erg
s-1 Å-1 at
~ 1500 Å, with
q0 = 0.5 (0.1), respectively (we
will follow this convention throughout this paper, unless explicitly
indicated). This is
about three order of magnitudes the luminosity density of the brightest
local star clusters studied with HST (see, e.g.,
Leitherer et al. 1996).
Given the short life-time of O and
B stars, it is relatively straightforward to convert the observed
absolute UV luminosities
into instantaneous rates of star formation once an IMF has been
assumed. Adopting a
continuous star-formation activity with a Salpeter IMP from 0.1 to 100
M , a galaxy at
z = 3 with
~ 24.5 forms
stars at the rate of 12 (29) h-250
M
yr-1 if q0 = 0.5 (0.1).
, a galaxy at
z = 3 with
~ 24.5 forms
stars at the rate of 12 (29) h-250
M
yr-1 if q0 = 0.5 (0.1).
These are almost certainly lower limits, since dust extinction and a
shorter burst age
result in larger rates (a burst with an age of
107 yr implies a
SFR 1.7x larger than the values above).
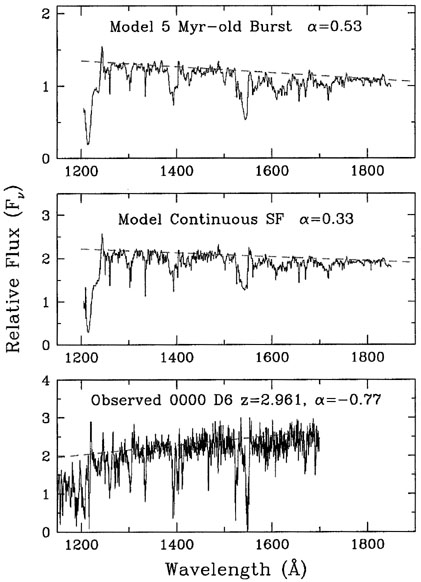
Calzetti et al. (1994) have shown that the far-UV spectral index is a robust indicator of dust reddening because it depends weekly on the exact shape of the IMF and the age of the burst. Both models and empirical templates of starburst galaxies shows that the spectral index expected in absence of dust obscuration is significantly bluer than what is typically observed in the Lyman-break galaxies, as is schematically illustrated in Figure 4. Although such a relatively red spectrum can be produced by stellar populations with a significant deficiency of massive stars (due either to a shallower IMF or an evolved burst), this possibility seems unlikely since even in the relatively red spectrum of Figure 4 itself we were able to directly see the photospheric lines of O stars. Thus, the presence of dust obscuration (as opposed to a deficiency of very massive stars) seems the explanation for the observed UV continua.
|
Figure 4. Spectral indexes of models of burst and continuous star-formation rates and of one observed Lyman-break galaxy. This last is characterized by the presence of photospheric lines of O stars, suggesting that dust obscuration, as opposed to lack of massive stars, is responsible for its reddening. The flux is in an arbitrary scale. The models are from Leitherer et al. (1995). |
A more detailed description of the amount of dust obscuration and the
correcting
factors to recover the intrinsic star-formation rates are discussed in
Dickinson's paper. Such corrections are in the range
3x - 7x, depending on the
exact shape of the extinction
curve, and although of modest amount, they are nevertheless of
sufficient amplitude to
affect our conclusions about the nature and possible evolutionary
history of both the
single Lyman-break galaxies and of the overall population in relation to
the general problem
of galaxy formation, as we will discuss later.
The Ly emission of the LBGs is
very often weak or absent despite the rather high
star-formation rates implied by the UV continua, in agreement with the
generally null
results of search for "primeval galaxies" based on the presence of this
emission line (e.g.,
Thompson et al. 1995).
Such a relatively weak
Ly is very likely the result of
resonant
scattering in presence of dust in an outflowing interstellar medium
(Charlot & Fall 1993).
The Ly, when detected, is
generally redshifted respect to the interstellar absorption lines
by several hundred km s-1 and its profile is often
asymmetric. The redshifts of both
the Ly and of the interstellar
lines are not likely to reflect the systemic redshift of the
galaxies. In the few cases of high S/N spectra where photospheric lines
from O stars
have been observed (SV1502
and
OIV1343) and also when the
optical nebular lines
([OII], H and
[OIII]) have been observed with near-IR spectra, the redshifts of these
features have been found to exceed that of the interstellar lines by up
to ~ 500 km s-1.
Or, in other words, if the bulk of the stars define the systemic
redshift of the galaxies
the interstellar lines are blueshifted respect to them. Taken together,
the phenomenology
of the Ly the interstellar,
stellar and nebular lines is consistent with the presence of
large-scale outflows in the interstellar medium of the Lyman-break
galaxies, very likely
the consequence of the injection of kinetic energy by stellar winds and
supernova events
(Pettini et al. 1997).
Large-scale motions of expanding shells are very
likely the main
reason for the large strengths of the interstellar lines, which
typically have equivalent
widths of a few Angstroms. Since these lines are saturated, these
equivalent widths are
much more sensitive to the velocity fields in the gas than to its metallicity.
and
[OIII]) have been observed with near-IR spectra, the redshifts of these
features have been found to exceed that of the interstellar lines by up
to ~ 500 km s-1.
Or, in other words, if the bulk of the stars define the systemic
redshift of the galaxies
the interstellar lines are blueshifted respect to them. Taken together,
the phenomenology
of the Ly the interstellar,
stellar and nebular lines is consistent with the presence of
large-scale outflows in the interstellar medium of the Lyman-break
galaxies, very likely
the consequence of the injection of kinetic energy by stellar winds and
supernova events
(Pettini et al. 1997).
Large-scale motions of expanding shells are very
likely the main
reason for the large strengths of the interstellar lines, which
typically have equivalent
widths of a few Angstroms. Since these lines are saturated, these
equivalent widths are
much more sensitive to the velocity fields in the gas than to its metallicity.