Copyright © 1991 by Annual Reviews. All rights reserved
| Annu. Rev. Astron. Astrophys. 1991. 29:
499-541 Copyright © 1991 by Annual Reviews. All rights reserved |
Over the last fifteen years, the unfolding picture of the universe has seemed like a photograph in the process of development, with the detail of structure appearing more vividly as each new compilation is added to the data base.
Until a few years ago, large-scale redshift efforts were concentrated in the northern hemisphere, but recent progress made by southern observers has brought the overall coverage closer to equipartition. At the beginning of 1990, the redshifts of more than 30,000 galaxies were known. The steep growth rate in measured redshifts makes a precise census difficult, especially because a significant fraction of the data base is still in unpublished form. A good part of that fraction is widely if informally circulated. In this section, we present a brief view of the 1990 redshift census as it is available to us. Our compilation of galaxy redshifts includes results of our own redshift surveys, totaling nearly 8000 objects; as well as the Center for Astrophysics (CfA) compilation, as kindly made available to us by J. Huchra in early 1989; the compilations of Richter & Huchtmeier (1989) and of Palumbo et al (1983); the Supergalactic Plane Survey of Dressler (1990); the Southern Sky Redshift Survey of Da Costa et al (1988), including unpublished southern data made available by L. Da Costa and P. Pellegrini; and a host of smaller data bases. While this census is both inhomogeneous and incomplete to varying degrees from region to region, it nonetheless provides a cursory three-dimensional picture of the large-scale structure of the nearby universe.
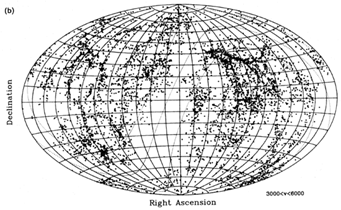
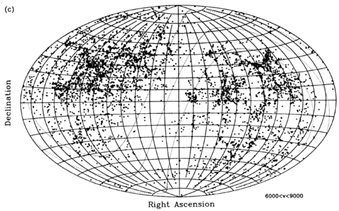
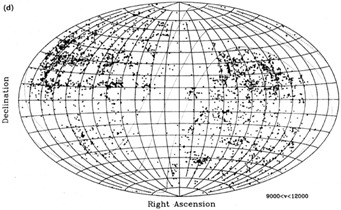
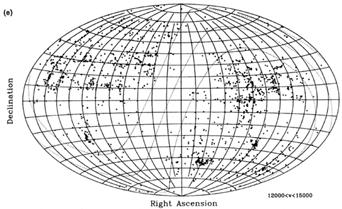
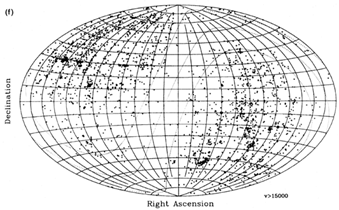
Figure 1 displays a heliocentric radial velocity histogram, in 500 km s-1 bins, up to 30,000 km s-1. With the caveats of the inhomogeneity of the data base and of its incompleteness (given our lack of access to some unpublished results and their rapid rate of growth), the histogram in Figure 1 resembles the redshift distribution expected of a sample with a limiting magnitude of mpg ~ 15, and a depth of about 75 h-1 Mpc (where H0 = 100h km s-1 Mpc-1). To complement Figure 1, Figures 2a through f attempt to provide an impression of the extent of the observational effort. Symbols represent individual galaxies with known redshift, superimposed on a grid of equatorial coordinates in an Aitoff projection. In order to provide equal graphic relevance to each galactic hemisphere, the projection is centered at R.A. = 6h. Each panel corresponds to a separate, nonoverlapping window of heliocentric radial velocity.

|
Figure 1. Histogram of the currently known distribution of heliocentric radial velocities up to 30,000 km s-1. |
In Figure 2a, the large asymmetry between northern- and southern- hemisphere coverage is not as much the result of sample selection or completion bias as of the preference for nearby galaxies to be located in the northern galactic hemisphere towards the central regions of the Local Supercluster. This asymmetry, already recognized a century ago has been understood in terms of the large-scale structure thanks to the pioneering work of G. de Vaucouleurs (1953, 1958). The most conspicuous concentration is of course the Virgo cluster. The supergalactic plane concentration of nearby galaxies is easily visible passing through Virgo. The two large southern clusters between 3h and 4h are Eridanus and Fornax. Beyond the Local Supercluster, several features are apparent as seen in Figure 2b. North of the equator in the southern galactic cap, the filamentary structure known as the Pisces-Perseus supercluster dominates. The total extent of this supercluster is unknown because it disappears to the North and East into the zone of avoidance. The Hydra and Centaurus clusters, which are nearly symmetric to this supercluster south of the equator in the northern galactic cap, are conspicuous in a region under intense scrutiny in searches for the ``Great Attractor''. In panel 2c, the Pisces-Perseus supercluster begins to fade, while the extensive enhancement associated with the Coma / A1367 clusters becomes dominant near the north galactic pole. The deeper sampling along the Center for Astrophysics constant-declination slices becomes particularly noticeable here.
|
In Figure 2c as in the following ones, another detail becomes prominent, i.e. the different depths with which the two hemispheres have been sampled. Southern samples, although rapidly growing in scope and depth, are still somewhat shallower than northern ones by about half a magnitude. The depth and completeness of available galaxy catalogs also varies, contributing to the inhomogeneity in the sampling across the sky (LyndenBell & Lahav 1988). One of the least-well covered regions is that between -2° and -18° in declination: although to the north of it, galaxian taxonomy is well represented by the Uppsala General Catalogue (UGC: Nilson 1973) and by the Catalogue of Galaxies and Clusters of Galaxies (CGCG: Zwicky et al 1963-68), and to the south by the ESO Uppsala Survey of the ESO(B) Atlas (ESO-UGC: Lauberts 1982) and its recent complement, the Surface Photometry Catalogue of the ESO-Uppsala Galaxies (Lauberts & Valentijn 1989), the intermediate region is only served by the Morphological Catalogue of Galaxies (MCG: Vorontsov-Velyaminov et al 1962-68), which is less complete and less photometrically and astrometrically accurate than the others.
|
|
In Figure 2d, the Hercules supercluster extends across the region between +10° and +40° near 16°. The concentration around A2151, the canonical Hercules cluster, connects via a low-density bridge to the northern enhancement around A2197 / A2199. In Figures 2e and 2f, the greatest concentration occurs in the Horologium region, 35° from the South Pole.
|
|
While omissions undoubtedly affect this overview in some details, its general characteristics are representative of the state of surveys within z < 0.05. Beyond that value, at this time only small area surveys are significant, a circumstance that will soon change as a result of ongoing or already-planned efforts.