
This element was discovered by Cavendish in London in 1766. Its name alludes to the fact that water is generatod when hydrogen burns in air.
Ionization energies
HI 13.6 eV.
Hydrogen is the simplest of the chemical elements. It is also the most abundant in the universe and is in many ways the most important chemical element for astrophysics.
Absorption lines
| Excitation | m = 1 | m = 2 | m = 3 | m = 4 | |
| n | potential (eV) | Lyman | Balmer | Paschen | Brackett |
| 2 | 10.2 | 1216 | |||
| 3 | 12.0 | 1026 | 6563 | ||
| 4 | 12.7 | 973 | 4861 | 18751 | |
| 5 | 13.0 | 950 | 4340 | 12818 | 40511 |
| 6 | 13.2 | 938 | 4101 | 10938 | 26251 |
| 7 | 13.3 | 931 | 3970 | 10049 | 21655 |
| 8 | 13.3 | 926 | 3889 | 9546 | 19445 |
| Limit | 13.5 | 912 | 3646 | 8203 | 14584 |
| Note: Wavelengths as usual are in ångström units. | |||||
It is customary to designate the first lines by the Greek letters alpha,
beta, gamma, etc. In the Balmer series the last letter used is epsilon. The
following lines are numbered according to their upper level, so the next
line after H epsilon is H 8. 'Limit' designates the wavelength for which
n =  .
.
| 4340(gamma) | 4862(beta) | ||||
| Type | V | I | V | III | Ia |
| O3 | 2.2 | 1.75(f) | |||
| O4 | 1.5 | ||||
| O6 | 1.8 | ||||
| O8 | 2.0 | ||||
| B0 | 2.8 | 1.3(Ia) | 2.5 | 0.8 | |
| B2 | 5.3 | 3.0(ib) | 4.1 | 2.7 | 1.0 |
| B3 | 6.9 | 1.6(Ia) | |||
| B4 | 5.2 | 5.0 | 1.2 | ||
| B5 | 6.7 | 1.7(Ia) | |||
| B6 | 7.8 | 6.5 | 5.8 | 1.5 | |
| B7 | 8.1 | ||||
| B8 | 10.0 | 2.5(Ib) | 9.0 | 7.2 | 1.8 |
| B9.5 | 9.9 | ||||
| A0 | 16.2 | 11.5 | 10.5 | 2.0 | |
| A1 | 19.4 | 3.1(Ia) | |||
| A2 | 17.8 | 3.7(Ia) | 13.0 | 10.5 | 2.0 |
| A3 | 15.9 | ||||
| A4 | 11.0 | 10.1 | 2.8 | ||
| A5 | 14.7 | 10.2 | 10.1 | 3.1 | |
| A7 | 13.3 | 9.9 | 9.8 | 3.9 | |
| F0 | 8.0 | 8.7(II) | 8.8 | 8.7 | 4.5 |
| F2 | 5.5 | 6.8 | 6.8 | 4.8 | |
| F5 | 5.5 | 7.3(Ib) | 4.7 | 5.1 | 5.5 |
| F8 | 4.4(Ib) | 3.2 | 4.8 | 4.0 | |
| G0 | 3.0 | 2.3 | 2.3 | 2.5 | |
| G2 | 2.6 | ||||
| G5 | 3.0 | ||||
Note: For KO III,
W(4340) = 1.0. All values have been smoothed, because
equivalent width measurements of Balmer lines have relatively large errors
attached.
|
|||||
| Type | V | III | I |
| O6 | 2.9 | 2.3f | |
| O9 | 3.0 | 2.8 | 2.6b |
| B0 | 3.9 | 3.4 | 2.7a |
| B2 | 5.4 | 3.9 | 2.5a |
| B5 | 7.5 | 6.5 | 2.7ab |
| B8 | 8.5 | 6.8 | 2.6a |
| A0 | 10.6 | 9.5 | 4.8b |
| A2 | 11.4 | ||
| A5 | 10.7 | 5.2 | |
| F0 | 5.5 | ||
| F2 | (3.1) | ||
| F5 | 3.0 | 3.4b | |
| G0 | 0.6 | 0.7 | 0.7b |
| Source: Date are from Andrillat et al. (1993). For type I the luminosity class is given after the W value. | |||
 |
 |
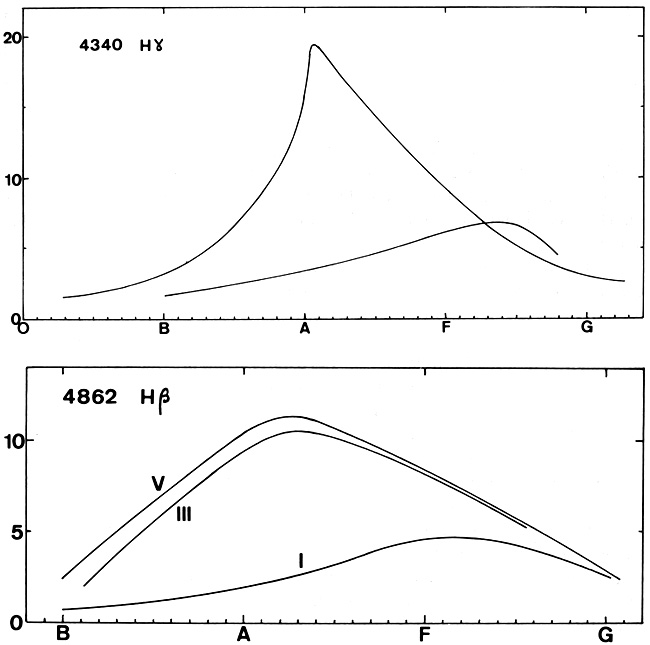
It can be seen that H lines appear in O-type stars, increase in strength to a maximum at about A 2 and decrease slowly thereafter. The strength of the hydrogen lines can also be measured photoelectrically by means of narrow band interference filters (see Golay (1974) and Jaschek and Jaschek (1987a) for details).
All hydrogen lines present a negative luminosity effect. This has led to extensive use of the strength of the Balmer lines for determination of luminosity (Golay 1974, Jaschek and Jaschek 1987a).
The line shape is determined by the Stark effect. Lines are narrow in supergiants and broad with large wings in dwarfs. With the Stark effect, the line profile varies with x-2.5 (x is the distance from the line center), which explains the extremely large wings of the lines. For instance the H gamma line extends over about 6 Åin B 3Ia, 30 Åin B 3 III and 50 Åin B 3 V (Petrie 1952).
Toward the end of the series, the lines overlap. The degree of overlapping depends on both the intensity and the narrowness of the lines (provided that the resolving power of the spectrograph is adequate). At the maximum strength of the Balmer lines (around A 2) one can see up to n = 28 in supergiants, n = 22 in giants, about n = 18 in dwarfs, n = 9 in subdwarfs and about n = 7 or 8 in degenerates. Since the number of the last visible Balmer line also depends very much on the plate factor of the spectrogram, the numbers given are just indicative.
In shell stars, for instance in 48 Lib, sometimes one can see up to n = 41 (Merrill and Sanford 1944), although admittedly this is an extreme case. The narrowness of the lines indicates that the lines are formed in an extremely low-density medium. For this same reason one observes n = 35 in the solar chromosphere (Mitchell 1947).
The convergence of the hydrogen lines towards the limit of the series produces a pronounced depression of the continuum, which extends well beyond the limit of the series. This discontinuity is also called a jump. Its size depends on the sharpness of the lines; it is therefore larger in supergiants than in dwarfs. The Balmer discontinuity has been used extensively in the Barbier-Chalonge classification system (see for instance Fehrenbach (1956)) and in broad band and intermediate band photometry, see Golay (1974).
Hydrogen lines in emission
In Oe stars Balmer and Paschen lines are in emission, H alpha
having up to W = 13 (Conti and Leep 1974, Andrillat et al. 1982).
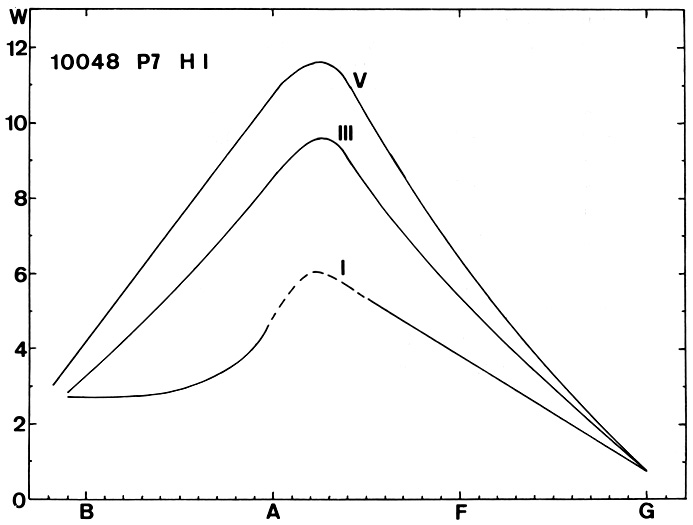
In Of stars some Balmer lines are seen in faint emission (Conti 1974). In the infrared region of the later WN stars P 7 is frequently seen in emission (W up to 35 Å) (Conti et al. 1990).
In Be stars and in B[e] stars one most frequently observes hydrogen lines in emission. The emissions are usually stronger in the first lines of the series (Balmer, Paschen, etc.) than in the higher lines. All emissions are variable with time. Many publications have been devoted to studying the emissions and their variation with time, starting with the discovery of the first Be star by Secchi in 1878. For recent work see for instance Andrillat and Fehrenbach (1982) for H alpha, Hanuschik et al. (1988) and Slettebak et al. (1992) for H beta, gamma, etc., Andrillat et al. (1990) for P 12 - 20 and Andrillat et al. (1990) for P 7.
The H alpha emissions may be quite strong, with W up to 90 Å, but are usually of the order of about 30 Å.
As a rule, the Paschen emissions are weaker than those of the Balmer series. Few observations exist for the Brackett and Pfund series, but in general the Brackett emissions are weaker than the Paschen emissions and those of the Pfund series are weaker than the Brackett emissions (Sellgren and Smith 1992).
The Balmer (or Paschen) discontinuity (or jump) is seen in emission in some Be stars. This was discovered by Barbier and Chalonge (1941). For illustrations see Schild (1976).
Balmer, Paschen and Brackett lines in emission are also seen in Herbig Ae-Be stars (Harvey 1984),compact infrared sources, high-luminosity early type objects like P Cyg and S Dor (for a general survey see Jaschek (1991)) and in symbiotic stars (Schild et al. 1992). In the latter W(Br alpha) and W(Br gamma) can be as large as 740 and 41 Årespectively.
In dKe or dMe stars H alpha is seen in emission, and for this reason the star is classified with the suffix `e'. dMe stars are most frequent towards later types and from dM4 onwards practically all stars are dMe. The emission is usually accompanied by emission in the other Balmer lines down to H delta and even to H 9.
Equivalent widths of H alpha are usually of the order of a few ångström units (W < 7 ångström). These emissions are at least partially of chromospheric origin (see PartTwo, section 3.1) and are usually of variable strength. There exists a general tendency for the emission to be stronger in later stars. If the variability is strong and accompanied by other emissions, then the star is called a `flare star'. The other accompanying emissions are (other) chromospheric lines such as CaII, as well a HeI 5876 and 6678 and the NaI D lines. Furthermore, in these stars, Lyman alpha is usually also present in emission (Doyle etal. 1990). In the M-type flare stars the Lyman alpha is as strong as the H alpha emission. It must be added that Lyman alpha emission is a more general phenomenon than the Balmer line emissions and in fact one finds Lyman alpha emissions in stars as early as type F. A catalog of Lyman alpha emissions has been published by Landsman and Simon (1993).
Emission lines are prominent in T Tau stars. W(H alpha) for instance is always larger than 5 Åand may reach 100 Å. However, the higher Balmer lines do not always behave in a regular way, in the sense of a gradual decrease of intensity. A11 lines are variable with time and show a wide variety of line profiles (Sun et al. 1985, Basri 1987, Bertout 1989). Balmer line emissions are weak in RR Lyr variables, and the same happens in Cepheids. Emissions are stronger in RV Tau and W Vir stars and are very strong in Miras of both populations. For an illustration of the different emissions see Gillet (1988).
In long-period variables, emission lines are present over a large part of the cycle, except around the minimum light (Merrill 1952, Joy 1954). The maximum strength is reached after maximum light. The Balmer series can be seen up to n = 14 at times when the star is on the descending branch of the light curve. Emission line intensities do not, however, follow the traditional pattern of a regular decrease of emission intensity, since H alpha and H beta are weaker than H gamma, delta and zeta (Merrill 1960).
Hydrogen emissions are present sometimes in semiregular variables, with variable strength from cycle to cycle (Querci and Querci 1989).
In novae, emissions are seen in the principal spectrum phase (Evans 1989). Supernovae may exhibit all series in emission (Arnett et al. 1989). Emission lines appear also in nova remnants, a few decades after outbursts (Warner 1989).
Balmer lines in emission are seen also in R CrB stars (Merrill 1951b).
Emissions are usually observed in symbiotic stars, in all of the Balmer, Paschen and Brackett series. In all cases the emission strengths are variable with time. For details see IAU Coll 103 (1988) and Baratta et al. (1991). The Balmer jump is also found in emission in all symbiotic stars (Allen 1988).
Behavior in non-normal stars
Balmer lines are very weak or absent in WR stars (Andrillat and
Vreux 1991). Hamann et al. (1991) find that, in hot WN stars, hydrogen is
absent, whereas it is present in cooler WN stars.
In some subdwarfs of types O and B, hydrogen is weak when compared with helium. So for instance H gamma, which is much stronger than the 4387 line in normal stars, can become comparable to the latter or much weaker. In the most extreme cases, H is absent (see for instance Hunger et al. (1981)).
H lines are weak or absent in the so-called extreme He stars (see the section on helium) and in many degenerates. According to the usual classification scheme for degenerates (see for instance Jaschek and Jaschek (1987a)) about half of all degenerates do show hydrogen lines whereas the other half do not show hydrogen at all. Of these the most important subgroup is that of the DB (degenerates of type B),where only He lines appear. Shipman et al. (1987) found in a study of DB stars that at least 20% do exhibit traces of H lines.
H lines are also very weak or absent in the spectra of DZ stars (W < 0.1 Å), see Sion et al. (1990).
H lines are very weak or absent in the spectra of one third of all central stars of planetary nebulue - in the so called H-deficient subgroup (Mendez 1991). In the other central stars, H lines are normal or strong and this constitutes the H-rich subgroup.
H lines are very weak or absent in the spectrum of pre-degenerate stars (Werner et al. 1990).
H line are absent in the spectra of supernovae of class I (and present in those of class II) (Branch 1990). Hill (1993) challenged this scheme for classification of supernovae on the grounds that it is an oversimplification based upon very few stars.
H lines are very weak in the spectra of R CrB stars (Cottrell and Lambert 1982).
In C stars hydrogen lines are weak, especially in C stars later than C 3. This contrasts with the strengths of the H lines in M-type stars of the same temperature (Yamashita 1967).
In stars in which the H content is abnormal, the Balmer discontinuity is abnormal too. This happens for instance in some A-type supergiants of the Magellanic Clouds, where both the Balmer jump and the hydrogen lines are too strong relative to the metallic lines (Humphreys et al. 1991).
H lines in stars with an intense magnetic field are split up into components. In normal stars with small magnetic fields such components are not seen because of the degeneracy of the levels. So for instance H alpha(6562) is split into three components located at 5870, 7129 and 8450 in a field of about 2 × 10⁸ G (Angel et al. 1985). Degenerates have polar fields up to 500 MG and neutron stars have fields in the range 1011 -1013 G.
Magnetic fields have been measured in some 30 degenerates of the DA and DC type (Bergeron et al. 1992). Strong magnetic fields are also present in cataclysmic variables (degenerates accreting matter from a companion star). For a recent summary see Chanmugam (1992) (see also the discussion on magnetic fields, p. 279).
Isotopes
H has two stable isotopes, H1 and H2 (deuterium),
whereas a third one, H3, is short-lived.
In the solar system the ratio H2/H1 is about 1.5 × 10⁻⁴. Deuterium has never been observed in stars and only upper limits to the H2 / H1 ratio can be provided. Ferlet et al. (1983) were able to derive an upper limit of 5 × 10⁻⁷ for an F 0II star. Vidal-Madiar et al. (1988) derived 5 × 10⁻⁶ for a B 2 V star.
Origin
Hydrogen was produced by cosmological nucleosynthesis.
Published in "The Behavior of Chemical Elements in Stars", Carlos Jaschek and Mercedes Jaschek, 1995, Cambridge University Press.