Copyright © 1994 by Annual Reviews. All rights reserved
| Annu. Rev. Astron. Astrophys. 1994. 32:
115-52 Copyright © 1994 by Annual Reviews. All rights reserved |
As mentioned in the introduction, the classification of galaxies by morphological appearance and the variation in scale properties within a single class are the primary discriminants among galaxies. Here we review the individual properties available from large surveys and attempt to identify the variations that relate more to form than to scale.
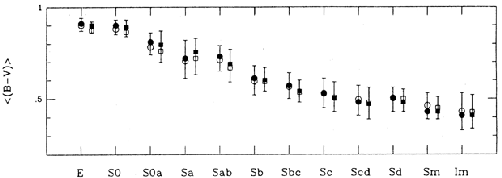
A classic study of galaxies was done by Holmberg (1958) who compiled and analyzed photometric data (integrated magnitudes, colors and diameters) for 300 galaxies. One of his main conclusions was the dependence of color on morphological type. Objects of different morphological classes show clear differences in their optical colors as measured by the color indices (U-B) and (B-V). Figure 5 shows the well-established trend between morphology and mean color. The E and S0 galaxies are clearly redder than their spiral counterparts, and the trend from redder to bluer is nearly monotonic. At the same time, the range of colors among the Sa galaxies overlaps that of Sc galaxies: some Sc's are as red as some Sa's while some Sa's are as blue as some Sc's. It is unlikely that this overlap results from misclassification or observational errors, but rather that the scatter reflects true variations in the colors, and presumably the current star formation rates, in individual objects.

Figure 5. (B-V) color vs. morphological type. (Same symbols as in Figure 2.) |
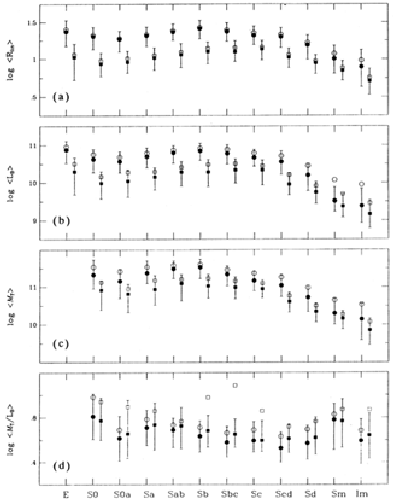
Both the median and mean values of linear diameters show subtle differences along the Hubble sequence as evident in Figure 2a with the most distinguishing feature being the ``smallness'' of the latest types. Within the RC3-LSc sample, the classical spirals show a small systematic increase in size toward the later types. Such a trend is less obvious in the flux-limited RC3-UGC sample. The largest early-type galaxies, the cD's, are underrepresented in the current sample since they are too rare to be found nearby. Their location in regions of highest local density suggests that their large sizes are related to their spatial locations in the deepest potential wells.

Figure 2.Global galaxy parameters versus morphological type. Circles represent the RC3-UGC sample, squares the RC3-LSc sample.Filled symbols are medians, open ones are mean values. The lower bar is the 25th percentile, the upper the 75th percentile. Their range measures half the sample. The sample size is given in Table 1. (a) log linear radius Rlin, (b) log blue luminosity LB, (c) log total mass MT, (d) log total mass-to-luminosity ratio MT / LB. |
It should be noted that the Malmquist bias also affects diameter-limited catalogs in the sense that objects at larger distances have characteristically larger linear diameters. The measurement of optical size enters into the debate concerning the degree of extinction internal to a spiral disk and into the surface brightness level to which a diameter measurement refers (Valentijn 1991; Burstein et al. 1991).