Copyright © 1984 by Annual Reviews. All rights reserved
| Annu. Rev. Astron. Astrophys. 1984. 22:
445-70 Copyright © 1984 by Annual Reviews. All rights reserved |


4.2 Cluster Samples
Inhomogeneity in the observed cluster samples, as well as differences in the data quality attained and the analytical techniques adopted by the various groups of workers, makes comparison of the H I properties of different clusters difficult. Following the relatively strict selection criteria adopted by a recent comparative study (42a, 46), we list in Table 2 a summary of properties of clusters for which extensive H I observations have been made. It should be pointed out that observations of large samples in the 21-cm line are currently constrained within recession velocities smaller than 10-15,000 km s-1. For each cluster in Table 2, we list its Abell radius rA (column 2), its systemic velocity and line-of-sight velocity dispersion (columns 3 and 4), the number of observed galaxies in the cluster sample (column 5), the number of these galaxies that are projected within 1rA of the cluster center (column 6), the H I-deficient fraction (column 7), the X-ray luminosity in the 2-6 keV range (column 8), and the references to published material (column 9). some of the listed quantities require further explanation. Only galaxies of type Sa or later are included; nondetections are used only if the upper limit for the H I flux sets the H I deficiency limits higher than 0.3; and H I deficiencies are all measured by the same criterion, namely, by using the diameter as the diagnostic variable, as described in Sections 2.1 and 4.1. The deficient fraction is defined as the ratio between the number of galaxies within 1rA> with H I deficiency in excess of 0.3 and the total number of galaxies observed within the same radius. The Hydra cluster (A 1060) sample does not conform with the criteria of sample membership listed above; we have tentatively estimated a deficient fraction from the MH / L values given in (88), which we list with the caveat of the inhomogeneity in this entry. Because the Virgo cluster has received more detailed attention, we devote Section 4.3 to a discussion of the related results concerning it.
| rA | v |  v v | H I def. | Lx | ||||
| Cluster | (°) | (km s-1) | (km s-1) | ntot | n1 | fraction | (erg s-1) | References |
| A262 | 1.75 | 5068 | 452 | 85 | 27 | 0.57 | 43.2 | 47 |
| Cancer | 1.92 | 4607 | 317 | 40 | 13 | 0.23 | < 42.6 | 46, 96 |
| A1060 | 2.39 | 3708 | 676 | 17 | 12 | - | 43.2 | 88 |
| A1367 | 1.40 | 6370 | 813 | 43 | 19 | 0.47 | 43.5 | 24,
25,
46,
106, 107 |
| Virgo | 5.00 | 1026 | 673 | 133 | 51 | 0.62 | 42.9 | 22,
28,
40,
41, 44, 114 |
| A1656 | 1.29 | 6950 | 905 | 56 | 17 | 0.82 | 44.2 | 24, 46, 106, 107 |
| Z74-23 | 1.52 | 5840 | 412 | 32 | 17 | 0.00 | < 42.8 | 23, 106 |
| A2147 | 0.83 | 10867 | 1189 | 34 | 14 | 0.64 | 44.1 | 43, 46, 96 |
| A2151 | 0.83 | 11055 | 920 | 40 | 20 | 0.33 | 43.6 | 43, 46, 96 |
| Pegasus | 2.20 | 3990 | 616 | 62 | 16 | 0.07 | < 42.5 | 13, 46, 87 |
|
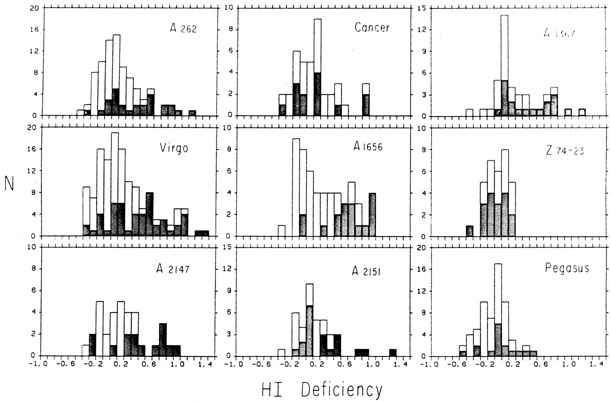
Figure 2. Histograms of H I deficiency in nine clusters. The upper envelope represents all galaxies in each cluster sample; the shaded one, those projected within one Abell radius from the center (42a). |
A clear pattern of H I deficiency in the central region is observed in at least 5 clusters: Virgo (see Section 4.3 for a broader discussion), Coma (A 1656; 24, 106, 107), A1367 (24, 25, 106, 107), A262 (47), and A2147 (43, 46, 96). A marginal case can be made for A2151 (43, 46, 96) and Hydra (88), while little or no deficiency is discernible in Cancer (46, 96), Pegasus (13, 46, 87) or Z74-23 (23, 106). Figure 2 (from 42a) summarizes the results for nine of the clusters listed in Table 2. In each case, the shaded blocks of each histogram correspond to the galaxies projected within 1rA of the cluster center, while the unshaded portions correspond to the total sample, as selected for Table 2. The deficiency end of the histograms tends to be strongly dominated by galaxies that lie close to the cluster center. In Figure 3 (also from 42a), differences in the radial extent of the deficiency pattern are illustrated for three well-studied clusters. In the case of Coma (A1656), deficient galaxies appear to prevail out to 1.5rA, while in A262 and A2147 (which are characterized by smaller deficient fractions) H I deficiency extends to less than 1rA. While the high deficient fraction of Coma is partly due to this difference in extent, Coma has also a very high proportion of galaxies with very high deficiencies, a detail not fully appreciated in Figures 2 and 3 because nondetections have been plotted at their nominal limit values.

|
Figure 3. H I deficiency as a function of radial distance in three clusters. Nondetections are plotted at the nominal lower limit of the inferred H I deficiency. Radial distance is scaled by the Abell radius rA of each cluster. |