


2.1 Kinematics of Optical Emission Lines
High-resolution optical images taken with ground-based telescopes and
especially with the Hubble Space Telescope (HST) show that many
giant elliptical galaxies contain nuclear disks of dust and ionized gas. The
most famous case is M 87
(Figure 2a). The disk
measures ~ 150 pc
across, and its rotation axis is closely aligned with the optical and
radio jet.
This is in accord with the BH accretion picture. The disk is in Keplerian
rotation (Figure 2b) around an object of mass
MBH  3 x
109 M
3 x
109 M .
Furthermore, this object is dark: the measured mass-to-light ratio exceeds 100
in solar units, and this is much larger than that of any known population of
stars. Moreover, the dark mass must be very compact: the velocity field
limits its radial extent to be less than 5 pc. Therefore its density exceeds
107 M
pc-3. Another illustration of this technique is given in
Figure 3. M 84, also a denizen of the
Virgo cluster of galaxies, is a
twin of M 87 in size, and it, too, harbors an inclined
nuclear gas disk
(diameter ~ 80 pc), whose rotation about the center betrays an invisible
mass of MBH
2 x 10⁹
M. Other
cases are reported (NGC 4261,
NGC 6251, NGC 7052), and searches for more are in progress.
.
Furthermore, this object is dark: the measured mass-to-light ratio exceeds 100
in solar units, and this is much larger than that of any known population of
stars. Moreover, the dark mass must be very compact: the velocity field
limits its radial extent to be less than 5 pc. Therefore its density exceeds
107 M
pc-3. Another illustration of this technique is given in
Figure 3. M 84, also a denizen of the
Virgo cluster of galaxies, is a
twin of M 87 in size, and it, too, harbors an inclined
nuclear gas disk
(diameter ~ 80 pc), whose rotation about the center betrays an invisible
mass of MBH
2 x 10⁹
M. Other
cases are reported (NGC 4261,
NGC 6251, NGC 7052), and searches for more are in progress.

|
Figure 2a. HST image of the ionized
gas disk near the center of
the giant elliptical galaxy M 87. The data were taken with the Second Wide
Field/Planetary Camera through a filter that isolates the optical emission
lines H |
|
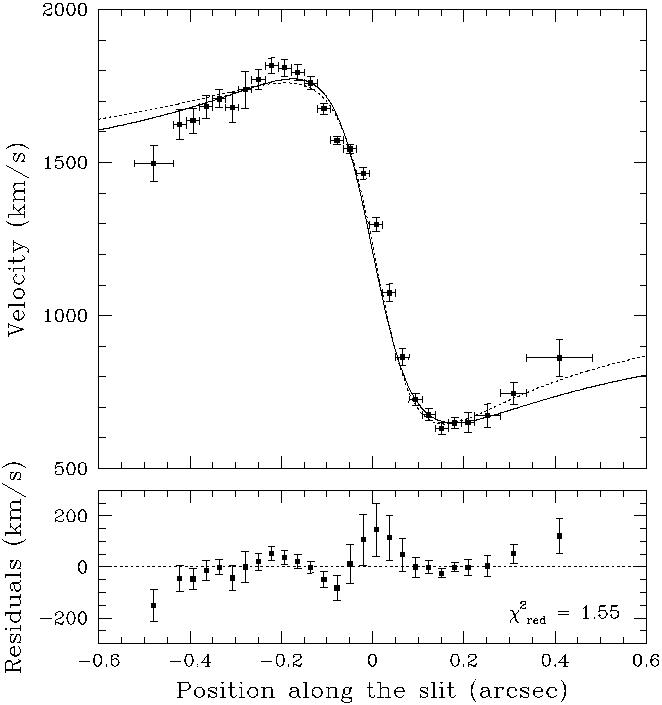
Figure 2b. Optical emission-line rotation curve for the nuclear disk in M 87. The data were taken with the Faint Object Camera on HST. The curves in the upper panel correspond to two different Keplerian thin disk models, and the bottom panel shows the residuals for the best-fitting model. [Figure adapted from Macchetto, F., et al. Astrophys. J. 489, 579 (1997).] |

|
Figure 3. (Left) HST image of
the central region of the
giant elliptical galaxy M 84; the box measures 22" x 19" or
1.8 kpc x 1.6 kpc for an adopted distance of 16.8 Mpc. The data were
taken with the Second Wide Field/Planetary Camera through a filter that
isolates the optical emission lines
H |
 and [N II]
