


11.2 The Comparison
We performed the comparison between methods by determining the mean
and the scatter in the natural logarithm of the ratio of a given
method's distances and those of SBF. PNLF and GCLF offer sufficient
accuracy in a single measurement to warrant comparison on individual
galaxies, so these results are reported as well as the comparison
of cluster averages.
Table 3 presents the results.
Column (1) names the method compared with SBF;
column (2) gives the number of objects compared;
columns (3) and (4) are the weighted average ratio between the method's
distance and SBF and  2
for the resulting scatter around this mean;
columns (5) and (6) list the unweighted average ratio and the rms scatter
in the natural logarithm around this unweighted average;
columns (7) and (8) give the median number of galaxies in a group used in
computing the average distance from the method
and the median error estimate among these galaxies;
and columns (9) and (10) list the same quantities for the SBF measurements.
Please note in columns (3) and (5) that the ratio between
Dn-
 and SBF
and SN Ia and SBF has units of km s-1 Mpc-1.
Table 3. Comparison Results
|
|
|
|
|
| (unwgt)
|
| Method
| SBF
|
|
| Method
| N
| < ratio >
|  2 2
| < ratio >
| rms
| <n>
| < d/d> d/d>
| <n>
| < d/d> d/d>
| Notes
|
|
PNLF
GCLF
PNLF
GCLF
SN Ia
Dn-
Dn-
Dn-
TF
TF
TF
| 14
9
7
6
6
34
32
12
34
24
14
| 1.027
1.156
1.072
1.117
85.4
86.5
89.3
91.1
0.921
0.960
0.986
| 23.6
3.7
6.4
3.0
20.0
70.3
32.8
11.8
100.8
67.6
15.2
| 1.054
1.157
1.094
1.127
92.4
92.5
92.8
92.5
0.909
0.974
0.970
| 0.088
0.140
0.078
0.152
0.248
0.227
0.165
0.123
0.275
0.237
0.127
| 1
1
1
1
2
2
2
4
4
5
9
| 0.044
0.120
0.056
0.160
0.133
0.149
0.149
0.105
0.157
0.122
0.083
| 1
1
1
2
2
2
2
2
1
1
1
| 0.052
0.050
0.057
0.052
0.050
0.052
0.045
0.052
0.052
0.050
0.055
| Individual galaxies
Individual galaxies
Cluster averages
Cluster averages
All clusters
2.5  clip applied clip applied
 3 in cluster 3 in cluster
All clusters
Has
H or CCD data
 5 in cluster 5 in cluster
|
|
There are three entries for Dn- because we deemed it interesting
to fit the distribution when two outlying points were removed, and to
see whether the accuracy of Dn-
 improved with greater numbers of
galaxies averaged together. As expected, the accuracy appears to improve
in both instances.
There are three entries for TF because
photographic and photoelectric TF measurements are sometimes
considered less reliable (see Sec. 7.1.1).
Hence, we fitted the distribution after those clusters with only these
data were removed. Although H and red CCD data do improve the
results, the distances are still highly inconsistent with SBF.
Thirdly, we fitted the distribution of only those clusters in which
at least 5 spirals had been observed. (The well-mixed groups of
Dorado, Telescopium, and Leo are also included in this sample.) In
these groups, we believe there is sufficient overlap, or co-mingling
between the spirals and early-type galaxies to be confident that
both types are at the same distance. In this case, the TF results
are consistent with those of the SBF.
| 
|
| 
|
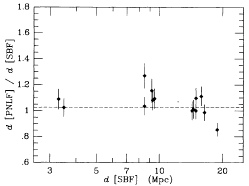
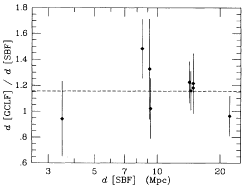
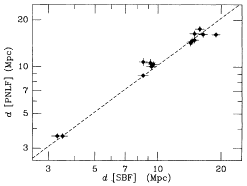
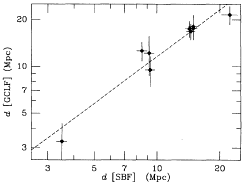
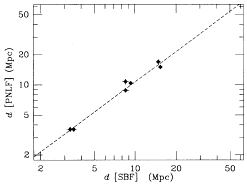
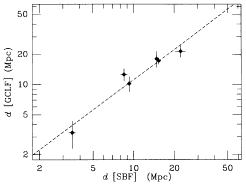
| Figure 25. SBF is compared with PNLF abd GCLF for
individual
galaxies. The left-hand panels are the PNLF distance plotted against
the SBF distance, and the ratio of the two plotted against SBF
distance. The right-hand panles give the same for the GCLF
distances. The dashed lines are drawn according to the weighted mean
ratio given in Table 3.
|
The comparisons between the various distances are shown graphically in
Figures 25-29. Figure 25 shows the comparison
between SBF and PNLF and SBF and GCLF for individual galaxies, and
Figure 26 presents the
comparison for PNLF and GCLF using cluster averages.

| 
|
| 
|
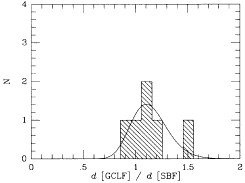
| Figure 26. SBF is compared with PNLF and GCLF
using cluster
averages. The left-hand panels show the PNLF distance plotted against
SBF distance, and the histogram of the ratios. The right-hand panels
are the same for GCLF. The dashed lines in the distance plots are the
weighted mean and the rms scatter from Table
3. Note that these are Gaussians in the natural logarithm, and
since the abscissa is the ratio itself, the Gaussians are skewed and
the peak does not correspond exactly to the mean value.
|
The agreement between PNLF and SBF gives us reason to believe that the
two methods are indeed approaching accuracies of 5%.  2 for
the individual galaxy comparison shows that there is a small
systematic component to the errors of order 5% which needs to be
understood, although the empirical allowance in the cluster distance
errors is very close to expectations. There is a zero point
difference of about 6% which is significant at the 2
 level,
in the sense that PNLF distances are larger than SBF distances.
It appears from the GCLF comparison that the GCLF method is more accurate
than its error estimates, perhaps by 40%. There
is again an offset in zero point relative to SBF of about
13% in the same sense as with PNLF which is significant at the
2 level. Either SBF distances are too
small by 13%, or the GC's in the early type galaxies studied here
are as much fainter than the GC's in the Milky Way, as the Milky Way
is fainter than M31.
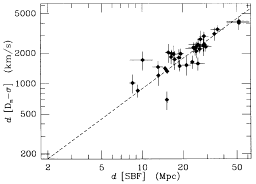
Figure 27 plots the comparison for
Dn- and SN Ia.
In these plots the distances have units of km s-1, and the
ratios have units of km s-1 Mpc-1, and thus
represent Hubble ratios
in which the zero-points have been set using the SBF distances.
| 
|
| 
|
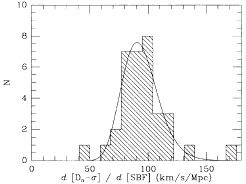
Figure 27. SBF is compared with Dn- and SN Ia. The left-hand panels
are the same for SN Ia distances. The dashed lines in the distance
plots are the weighted mean ratios from Table 3,
and the smooth curves on the histogram plots are the Gaussians derived
from Table 3. The Dn- and SN Ia. The left-hand panels
are the same for SN Ia distances. The dashed lines in the distance
plots are the weighted mean ratios from Table 3,
and the smooth curves on the histogram plots are the Gaussians derived
from Table 3. The Dn- curves come from the fits which
have the two outliers removed. In these plots the distances have units
of km s-1 Mp-1. curves come from the fits which
have the two outliers removed. In these plots the distances have units
of km s-1 Mp-1.
|
Dn- works
remarkably well. There seems to be a small incidence
of galaxies for which Dn-
 is substantially worse than its error
estimate, but if these outliers can be identified and removed, the
errors seem to be accurate. The mean ratio between
Dn-
 and
SBF is about 90 km s-1 Mpc-1.
The assumed error of 0.35 mag for the SN Ia errors seems to be an
underestimate. Because the data are such
a heterogeneous mix of old photographic data, it is not possible to
make a meaningful comment on the intrinsic value of SN Ia as distance
estimators except to say that they are certainly better than 0.5
magnitude per supernova. The zero point in this comparison results
in 85 km s-1 Mpc-1, which is in good agreement with
Dn- and TF.
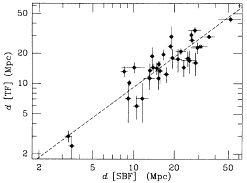
Figure 28 shows how the TF distances compare
with SBF. The very poor
agreement between TF and SBF distances is a surprise.  2
indicates that the errors in TF distances to groups with ellipticals
are significantly worse than the error estimates. The factor is the
same for H band and red CCD data as for photographic and
photoelectric data, so the latter are not at fault. We plotted the
ratio of Dn-
 and SBF against the ratio of TF and SBF, and found no
correlation at all, so it is unlikely that the scatter comes from the
SBF distances.

| 
|
| 
|
| Figure 28. SBF is compared with TF distances. The
left-hand
panels show all of the TF data, as in Fig. 26,
and the right-hand panels show the TF data which has been pruned of all
the clusters for which only the B-band data are available.
|
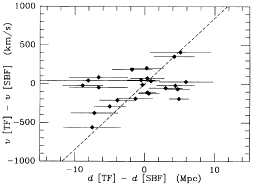
In order to explore the hypothesis that this inconsistency arises
from the TF distances to spirals which may not be associated with
elliptical galaxies with SBF distances, we plot in the upper left panel
of Figure 29 the velocity difference versus the
distance difference
for the TF clusters with H or red CCD data and the corresponding SBF
clusters. There is a poor but significant correlation present,
suggesting that some of the clusters are separated in space and
have a velocity difference arising from an undisturbed
Hubble flow. That is, it appears to be more difficult to assign
cluster membership to the spirals than to the ellipticals.
In the lower left we reproduce the panel from the lower
right of Figure 28, with lines showing SBF
distance plus and minus 8
Mpc. This delineates the envelope of the points pretty accurately,
and plausibly reflects the km s-1 Mpc-1 velocity
selection criterion used
to decide whether a spiral group was coincident with an elliptical
group.
| 
|

| 
|
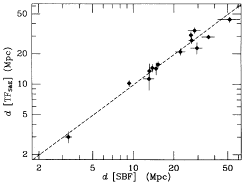
| Figure 29. The upper left-hand panel shows the velocity
difference vs the distance difference for the TF clusters with H
or red CCD data and the corresponding SBF clusters. In the lower
left-hand side we reproduce the panel from the lower right-hand side of
Fig. 28, with lines showing SBF distance
± 8 Mpc. The right-hand panels show the comparison of SBF and TF
when the sample is restricted to populous groups of spirals which we
judged are likely to be co-mingled with their elliptical counterparts.
|
The right panels of Figure 29 show the
distribution of TF distances
relative to SBF distances when the TF sample is restricted to those
which are most likely to be closely associated with the adjacent
cluster of elliptical galaxies. In this case
the differences between TF and SBF become consistent with
the errors.
The TF-SBF comparison, in general, deals with disparate
galaxies (spirals versus ellipticals) in which few, if any, galaxies
are common to both methods. Consequently, we see differences that are
larger than the formal expectations unless the samples are carefully
chosen.
Thus, we believe that the TF error estimates probably
are accurate, but that spiral and elliptical groups are often
substantially disjoint, more so than is widely appreciated. At the
risk of overinterpreting Figure 29, about half
of the outlying spiral groups appear to follow the Hubble flow relative
to the elliptical group, and about half have the same velocity at
different distances, equally divided between near and far. The
implications that this has for cluster virialization and large scale
flows are beyond the mandate of this review.
The ratio of the restricted TF sample and SBF is not significantly
different from unity (~ 0.98 ± 0.03) and the level of agreement
is comparable to that of the PNLF-SBF agreement. The larger
uncertainties in the TF method are statistically reduced by a larger sample.


 2
for the resulting scatter around this mean;
columns (5) and (6) list the unweighted average ratio and the rms scatter
in the natural logarithm around this unweighted average;
columns (7) and (8) give the median number of galaxies in a group used in
computing the average distance from the method
and the median error estimate among these galaxies;
and columns (9) and (10) list the same quantities for the SBF measurements.
Please note in columns (3) and (5) that the ratio between
Dn-
 and SBF
and SN Ia and SBF has units of km s-1 Mpc-1.


 d/d>
d/d>
 3 in cluster


