Copyright © 1995 by Annual Reviews. All rights reserved
| Annu. Rev. Astron. Astrophys. 1995. 33:
581-624 Copyright © 1995 by Annual Reviews. All rights reserved |
Kormendy's CFHT BH search is being extended to 14 E-Sb galaxies
with MB  -17.5 and distance
  10
Mpc. Evidence for MDOs is seen in ~ 20% of these galaxies (M31, NGC 3115, and NGC 3377). Failures often occur
where detection is unlikely because of nuclear
starbursts or because the galaxy is too face-on. An example (not from the
statistical sample) is NGC 1316 (Fornax A). The central dispersion is only
222 ±4 km s-1 despite an unusually small and dense core
(Schweizer 1980;
Kormendy 1987b; Fabbiano et al. 1994). The core has M /
LV
  1.5,
presumably due to an ongoing starburst (Schweizer 1980). In such a case it is
impossible to conclude anything about whether there is a BH.
It is no accident that MDOs have been found only in galaxies with favorable
conditions; i.e., in edge-on bulges with rapidly rotating nuclear
disks and in rotating ellipticals. Despite this, we have already found
 108
M
108
M of dark
matter per L* of galaxy luminosity [where L* =
characteristic luminosity of the Schechter 1976 luminosity
function]. This is approximately
the mass in dead quasars that is predicted by energy arguments (Soltan 1982;
Rees 1984; Chokshi & Turner 1992).
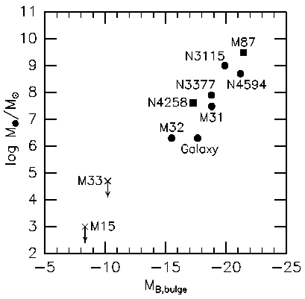
With eight detections, we can start to look at demographics. If MDOs are BHs, then Figure 14 shows that BH mass correlates with bulge luminosity. The mean BH mass fraction is <MBH / Mbulge> = 0.0022+0.0016-0.0009 (we averaged log MBH / Mbulge from Table 1). If we omit the Galaxy, which has the smallest MBH / Mbulge = 0.00017, then <MBH / Mbulge> = 0.0032+0.0018-0.0012. M33 is consistent with this correlation, but also with the hypothesis that supermassive BHs are found only in bulges.

Figure 14. BH mass as a function of bulge absolute magnitude. The symbols are the same as in Figure 3. As in Figure 3, the correlation may be only the upper envelope of a distribution that extends to smaller MBH. |

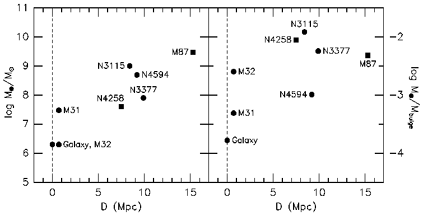
Figure 15. Correlations with distance D of detected BH mass (left) and BH mass divided by bulge mass (right). |
Figure 15 shows the correlations of
MBH and
MBH / Mbulge
with distance. It illustrates the selection effects in the search. Not
surprisingly, MBH correlates well with distance. Giant
galaxies like
M87 and NGC 4594 are rare; if MBH  Mbulge, then we are unlikely
to find 109-M
 BHs nearby. This is why the upper-left part of the
diagram
is empty. On the other hand, 107-M
 BHs cannot be detected
much outside
the Local Group. This ensures that the lower-right part of the diagram will
remain empty until we get better spatial resolution.
There is little correlation of MBH / Mbulge with D. Most BH detections were approximately equally difficult, a point made also by Rix (1993). NGC 3115 has the largest fractional BH mass and is one of the most definitive detections. M31 and the Galaxy have small fractional BH masses; a detection was possible in M31 because the nucleus rotates rapidly and in the Galaxy because the center is so nearby.