


6.4. Line Profiles and Kinematics
The kinematic information contained in line profiles provides unique clues to the LINER puzzle. However, aside from a small handful of relatively crude line width measurements (e.g., Dahari & De Robertis 1988; Whittle 1993, and references therein), little else is known about the line profiles of LINERs as a class. Indeed, with a few exceptions, the FWHM of the forbidden lines in LINERs rarely exceed 500 km s-1, the typical resolution of many of the older surveys. Since the initial study of Heckman (1980b), it has commonly been assumed that the line widths of LINERs are roughly comparable to those of Seyferts (Wilson & Heckman 1985; Whittle 1985, 1993), although Stauffer (1982b) has remarked, admittedly based on very small number statistics, that LINERs seem to have broader lines than Seyferts. The study of Phillips et al. (1986), whose spectral resolution is comparable to that of the Palomar survey, also has clearly shown that the typical line widths in LINERs are substantially smaller than what Heckman had first thought.
Let us reexamine some of these issues using the new data set at hand. Despite
being blended with H most of
the time, I will use [N II]
most of
the time, I will use [N II]  6583 as the
fiducial probe of the velocity field of the NLR, since it is usually the
strongest line in the red spectrum, and it is relatively unaffected by stellar
absorption. [O III] 5007
normally is more ideal for measurement of
narrow-line profiles, but, in our case, both the S/N and the resolution of the
blue spectra are lower than those of the red spectra. The line widths range
from being unresolved (
6583 as the
fiducial probe of the velocity field of the NLR, since it is usually the
strongest line in the red spectrum, and it is relatively unaffected by stellar
absorption. [O III] 5007
normally is more ideal for measurement of
narrow-line profiles, but, in our case, both the S/N and the resolution of the
blue spectra are lower than those of the red spectra. The line widths range
from being unresolved ( 115 km s-1) to 500-700 km s-1, with a median value
(excluding the first bin, whose values are very uncertain because they are
near the resolution limit) of 350, 230, and 290 km s-1,
respectively, for LINERs, transition objects, and Seyferts
(Fig. 7).
115 km s-1) to 500-700 km s-1, with a median value
(excluding the first bin, whose values are very uncertain because they are
near the resolution limit) of 350, 230, and 290 km s-1,
respectively, for LINERs, transition objects, and Seyferts
(Fig. 7).

|
Figure 7. Distribution of FWHM of [N II]
|
The characteristic line widths of LINERs reported here are much smaller than those found by Heckman (1980b), and generally consistent with those from other moderate-resolution studies. Not surprisingly, transition objects have narrower lines compared to LINERs; this is to be expected because of the difference in their average Hubble types and the well-known dependence of nebular line width on bulge prominence (e.g., Whittle 1992a, b). What is unexpected is the clear difference evident between LINERs and Seyferts: LINERs have wider forbidden lines than Seyferts, significant at a level greater than 99.999% according to the K-S test.
|
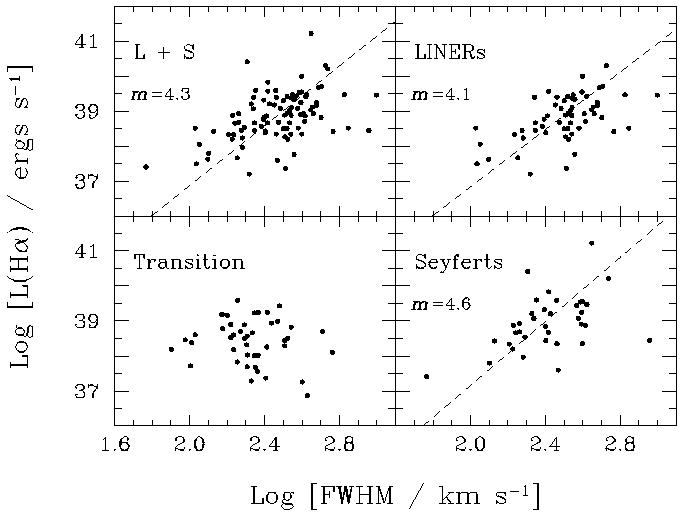
Figure 8. Correlation between
H |
Since it was first pointed out by
Phillips et al. (1983),
it has been
well established that the luminosities of the forbidden lines in Seyfert nuclei
are positively correlated with their widths
(Whittle 1985,
1992b).
The Seyferts in our sample similarly obey this correlation
(Fig. 8),
although, interestingly, the slope of the correlation (4.6) is somewhat
shallower than that of the more luminous Seyferts in
Whittle's (1992b)
sample
(slope  5.5). LINERs
evidently also obey the correlation, contrary to what
Wilson & Heckman (1985)
thought; the shallower slope (4.1) reflects the
larger line widths found in LINERs. Transition objects, on the other hand,
appear not to follow the correlation, although it is likely that the
correlation has been partially masked by our inability to completely resolve
the narrower lines in this class of objects. The interpretation of the
relation between line luminosity and line width has been unclear, mainly
because of the existence of other mutual correlations between line width, line
luminosity, and radio power
(Wilson & Heckman 1985).
The recent analysis
by Whittle (1992b),
however, shows quite convincingly that the fundamental parameter
underlying all these correlations is the bulge mass (or central gravitational
potential) of the host galaxy.
5.5). LINERs
evidently also obey the correlation, contrary to what
Wilson & Heckman (1985)
thought; the shallower slope (4.1) reflects the
larger line widths found in LINERs. Transition objects, on the other hand,
appear not to follow the correlation, although it is likely that the
correlation has been partially masked by our inability to completely resolve
the narrower lines in this class of objects. The interpretation of the
relation between line luminosity and line width has been unclear, mainly
because of the existence of other mutual correlations between line width, line
luminosity, and radio power
(Wilson & Heckman 1985).
The recent analysis
by Whittle (1992b),
however, shows quite convincingly that the fundamental parameter
underlying all these correlations is the bulge mass (or central gravitational
potential) of the host galaxy.
In light of the dependence of line width on luminosity, it is hardly surprising that the ``typical'' Seyfert nucleus has much narrower lines than conventionally assumed. Hence, the criterion for distinguishing Seyfert 2 nuclei from ``normal'' emission-line nuclei (i.e., H II nuclei) on the basis of the widths of the narrow lines, either as originally proposed by Weedman (1970, 1977), or as later modified by Balzano & Weedman (1981) and Shuder & Osterbrock (1981), is clearly inappropriate for the majority of the Seyfert galaxy population and should be abandoned.
Keel (1983b) found that in his sample the widths of the forbidden lines are well correlated with galaxy inclination, implying that motion in the plane of galaxy disks dominates the velocity field of the NLR. The present data set does not support this conclusion; no significant correlation between FWHM([N II]) and galaxy axial ratio is seen for any of the subclasses of nuclei, or for all the subclasses added together. Other studies have come to the same conclusion (Heckman et al. 1981; Wilson & Heckman 1985; Whittle 1985; Véron & Véron-Cetty 1986). One can make the inference that either the NLR does not have a disk-like geometry in the plane of the galactic disk, or that the component of the velocity field in the galactic plane contributes only a portion of the total observed line widths (Whittle 1985, 1992a).
Of course, the FWHM is the crudest, first-order characterization of the line profile. Actually, the shapes of the emission lines in most emission-line nuclei, when examined with sufficient spectral resolution (e.g., Heckman et al. 1981; Whittle 1985; Veilleux 1991; Ho et al. 1996f), deviate far from simple analytic functions (such as a Gaussian), often exhibiting weak extended wings and asymmetry. In fact, most Seyfert nuclei have asymmetric narrow lines, and there seems to be a preponderance of blue wings, usually interpreted as evidence of a substantial radial component in the velocity field coupled with a source of dust opacity. It would be highly instructive to see if this trend extends to LINERs, as it could offer insights into possible differences between the NLRs in the two types of objects. These subtleties have never before been examined systematically in LINERs.
The majority of the LINERs in our survey have emission-line spectra of adequate S/N such that possible profile asymmetries (at, say, 20% of the peak intensity) can be discerned (Fig. 9a). Among these, ~ 30% are symmetric, ~ 50% have blue asymmetry, and ~ 20% have red asymmetry. Seyferts do not show any obvious differences compared to LINERs, although a much larger proportion of transition objects (~ 60%) are observed to have symmetric line profiles. The latter finding is probably insignificant, since it is more difficult to identify profile asymmetries in objects having narrower lines. From these results, one can conclude that (1) both LINERs and Seyferts seem to exhibit similar trends in their narrow-line asymmetries and that (2) when present, the sense of the asymmetry is preferentially to the blue.

|
Figure 9. (a) Examples of LINERs showing line profiles with blue (NGC 1961) and red (NGC 3190) asymmetry. (b) Examples of LINERs having forbidden lines whose widths vary with critical density. Note that in both cases [O I] is broader than [S II]. |
Detailed studies of Seyferts (e.g.,
De Robertis & Osterbrock
1984,
1986) and
LINERs
(Filippenko & Halpern 1984;
Filippenko 1985;
Filippenko & Sargent 1988;
Ho et al. 1993,
1996b)
in the past have found that the widths of the
forbidden lines correlate positively with their critical densities. This
empirical trend has been interpreted as evidence that the NLR contains a wide
range of gas densities (102-107 cm-3), stratified such that the densest
material is located closest to the center. In such a picture, [O I]
6300 (ncrit
106
cm-3) should be broader than [S II]
6716, 6731 (ncrit
3 x 10³
cm-3).
Among the objects with securely determined FWHM for [O I] and [S II], approximately 15%-20% of LINERs and 10% of Seyferts show detectable evidence of density stratification in the sense that FWHM([O I]) > FWHM([S II]) (see Fig. 9b for examples). In no instance is [O I] ever observed to be narrower than [S II]. However, these numbers need to be interpreted with caution. They do not imply that objects failing to show such profile differences do not have density stratification, since a number of effects can conspire to hide this observational signature (Whittle 1985). Furthermore, one's ability to discern such profile differences depends strongly on the S/N of the data (and on the resolution compared with FWHM), and undoubtedly many objects have escaped notice because of this observational selection effect.
Whittle (1985)
finds that Seyfert 1 nuclei have a greater likelihood of
showing profile differences in their forbidden lines than do Seyfert 2s. The
implication is that somehow density stratification in the NLR is directly
related to the presence of a BLR. In the present sample, the same trend
seems to hold (see also
Ho et al. 1993),
in that, among those objects with
detectable profile differences between [O I] and [S II], ~ 50% of the
LINERs and ~ 80% of the Seyferts have broad
H emission, significantly
higher than the respective detection rates of broad
H in the whole sample
(Section 7). But, once again, this result is
difficult to evaluate, since
selection effects heavily favor the detection of both of these traits in
objects having data of high S/N.