


4.3.2. Model outflow cone
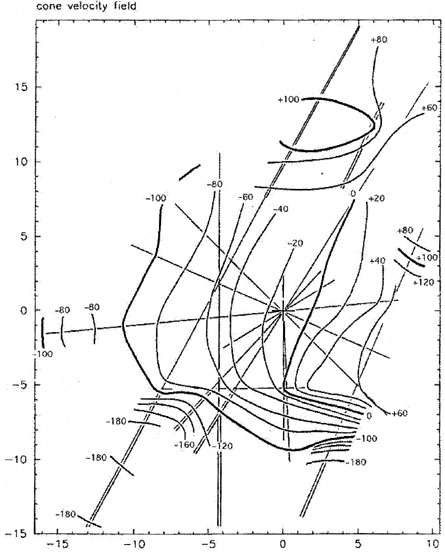
The velocity field of the outflow cone in NGC 1365, shown in
Fig. 21, was derived by
Hjelm and Lindblad (1996)
from a number of slit spectra containing the [O III]
 4959, 5007 and [Ne III]
3869 lines. The authors
fitted a model of an outflow double cone to the
observations with the requirement that it should reproduce the
velocities along the slits, giving the cone field of
Fig. 21, as well as the distribution of the
intensity of
line emission as found along the slits and in the narrow band image from
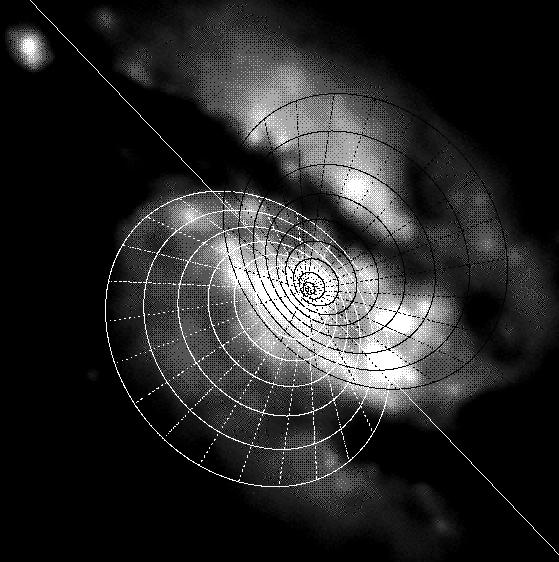
Fig. 16b. The geometry of the cone
in the best fitting model
is shown in Fig. 22.
We see the cone extending from the nucleus out of the galactic plane
with its symmetry axis closely aligned with the rotation axis of the
galaxy. The counter cone is seen below the plane through absorbing dust.
In this model the emission in the [O III] lines originates from three
components:
4959, 5007 and [Ne III]
3869 lines. The authors
fitted a model of an outflow double cone to the
observations with the requirement that it should reproduce the
velocities along the slits, giving the cone field of
Fig. 21, as well as the distribution of the
intensity of
line emission as found along the slits and in the narrow band image from
Fig. 16b. The geometry of the cone
in the best fitting model
is shown in Fig. 22.
We see the cone extending from the nucleus out of the galactic plane
with its symmetry axis closely aligned with the rotation axis of the
galaxy. The counter cone is seen below the plane through absorbing dust.
In this model the emission in the [O III] lines originates from three
components:
|
Figure 21. The cone velocity field. The spectral slit positions are shown as straight lines, and the double lines indicate where double line profiles have been measured. Where double lines have not been seen the field is blended with the disk field. The zero point velocity is +1630 km s-1 and the contour interval is 20 km s-1. The units on the axes are arcseconds offset from the centre. From Hjelm & Lindblad (1996). |
|
Figure 22. Model ionization double cone reaching out from the nucleus of NGC 1365. The straight line marks the line of nodes. The NW (upper right) side of the galaxy is the near one. The cone axis is closely aligned with the rotation axis of the galaxy and the counter-cone is seen absorbed through the galactic plane. From P.O. Lindblad et al. (1996b). |
The model has 13 independent free parameters which were varied to obtain the best fit. The most important properties of the cone, given by those parameters are:
The position angle of the cone axis projected on the sky differs only 1° from that of the radio jet of Sandqvist et al. (1995) (see Section 4.4). Assuming that the cone axis and the jet are actually aligned in space we then will know the inclination of the jet to the line of sight. On the assumption that the absence of a counter-jet is exclusively due to relativistic beaming, Hjelm and Lindblad found that the jet velocity must be > 0.7c, where c is the velocity of light. On the other hand, the authors conclude that a nuclear disk with typical values as a temperature of 104 K, electron density of 104 cm-3 and a column density of 1023 atoms cm-2 could give an optical thickness in the radio domain sufficient to block out the radiation from a counter-jet.
Astrophysically meaningful line ratios, where the undisturbed cone
contribution could be separated out from other components, could only
be obtained from one region in the counter cone where also the
H , [N II]
6583 and [S II]
6716,
6731 lines were seen split. The ratios [N II]
6583 /
H
and [S II] (6716 +
6731) /
H from the cone,
although very uncertain, fall in the realm of narrow line regions in
AGNs in the diagnostic diagram of
Veilleux and
Osterbrock (1987).
The line ratios from the disk component on the other hand indicate a large
contribution of light from star forming regions.
, [N II]
6583 and [S II]
6716,
6731 lines were seen split. The ratios [N II]
6583 /
H
and [S II] (6716 +
6731) /
H from the cone,
although very uncertain, fall in the realm of narrow line regions in
AGNs in the diagnostic diagram of
Veilleux and
Osterbrock (1987).
The line ratios from the disk component on the other hand indicate a large
contribution of light from star forming regions.
The nuclear region of NGC 1365 was observed in the [O III]
5007 line and the
neighbouring continuum with the HST/FOC by
Kristen et al. (1997).
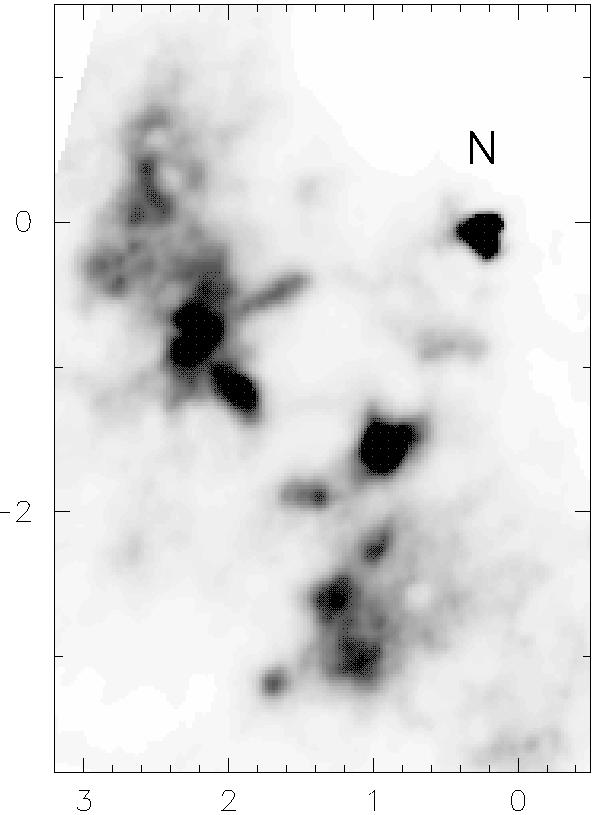
As seen in Fig. 23 the HST image resolves the
inner part of the outflow cone into numerous
small clouds and a number of larger aggregates. Kristen et al. estimate
the total [O III] luminosity of the half cone turned to us within
the HST/FOC frame to be L[OIII]
 3.7 x 1040
erg s-1.
3.7 x 1040
erg s-1.
|
Figure 23. Deconvolved and continuum
subtracted HST image of the nucleus
(N) and the outflow cone in the light of [O III]
|
Similar cloud structures have previously been observed by the HST for the [O III] cones in the prototype Seyfert galaxies NGC 1068 (Macchetto et al. 1994) and NGC 4151 (Evans et al. 1993; Boksenberg et al. 1995).