


The story begins in 1933 with Jansky's discovery of the radio emission from the Galaxy. It was immediately apparent that, on large angular scales, the radio sky is dominated by diffuse Galactic emission. As is well known, this great discovery caused little stir in the astronomical community and it was only after the Second World War that the nature and origin of the radio background emission became the object of astronomical interest. By the late 1940s, the emission mechanism was identified as synchrotron radiation and, at about the same time, the first of the discrete radio sources was identified.
At that period, one of the principal motivations for attempting to
extract the diffuse
extragalactic component of the radio background radiation was related to
the question
of the distances and luminosities of the discrete radio sources which
continued to be
discovered as the sky surveys discovered more and more faint
sources. The argument
is a well-known one and goes as follows. Suppose the sources have
typical luminosities
L and space
densities
and space
densities  L.
Then the diffuse background emission due to a uniform
cosmological distribution of these sources is
L.
Then the diffuse background emission due to a uniform
cosmological distribution of these sources is

|
On the other hand, if we also measure the number of sources brighter
that a given flux
density S, N( S), that number is given by
|
Since the observed background intensity
I is an upper limit
to the integrated intensity,
and N ( S) is fixed,
we can find a lower limit to
L. This was the
argument used
by Martin Ryle to demonstrate reasonably convincingly that the bulk of
the discrete
radio sources had to be distant extragalactic objects. It was also the
motivation for
attempting to disentangle the intensity of the isotropic radio
background emission from
the anisotropic Galactic radio emission which was much more intense. This was a
very difficult observational programme and several generations of
Cambridge research
students were almost broken in attempting to find a credible result.
The problem is that the radio sky is dominated by the synchrotron emission of our own Galaxy as is beautifully demonstrated by the map of the whole sky due to Glyn Haslam and his colleagues at the Max Planck Institute for Radio Astronomy at Bonn. As a result, wherever one looks in the sky, there is always intense radiation in the far out sidelobes of the radio telescope. The best one can do is to map the sky at different wavelengths with geometrically scaled antennae so that although the sidelobe problem is not eliminated, at least it should be the same at different frequencies. What one observes on the sky is
|
where the first term on the right-hand side represents the anisotropic
component
associated with the Galaxy and the term I0(v)
represents the isotropic extragalactic
component. The procedure is then to map the sky at different
frequencies, assume that
the anisotropic component has the same radio spectrum in all directions
and then find
I0(). The procedure
only works because the Galactic continuum spectrum is different
from that of the diffuse extragalactic component, specifically, the
spectrum of our Galaxy having the form
I
 -0.4 at frequencies less
than about 200 MHz whereas the extragalactic sources have much steeper spectra.
-0.4 at frequencies less
than about 200 MHz whereas the extragalactic sources have much steeper spectra.
The best results are still those presented by
Bridle (1967).
It is convenient to express
the results in terms of the brightness temperature of the radiation
Tb =
( 2 / 2k)
I. At
the traditional wavelength of 178 MHz, the frequency of the revised 3C
Catalogue, the
results are a follows. The minimum sky temperature at 178 MHz is about 80 K and
includes both the minimum Galactic component as well as the isotropic
component.
As the errors build up, it is not possible to determine both the
intensity and spectrum
of the extragalactic component and so the isotropic component is
extracted assuming
different values for the radio spectral index. If
2 / 2k)
I. At
the traditional wavelength of 178 MHz, the frequency of the revised 3C
Catalogue, the
results are a follows. The minimum sky temperature at 178 MHz is about 80 K and
includes both the minimum Galactic component as well as the isotropic
component.
As the errors build up, it is not possible to determine both the
intensity and spectrum
of the extragalactic component and so the isotropic component is
extracted assuming
different values for the radio spectral index. If
 = 0.75, the isotropic background
temperature is 30 ± 7 K; if
= 0.9, the intensity
corresponds to 15 ± 3 K. The typical
spectral index of radio sources at 178 MHz is about
= 0.8.
= 0.75, the isotropic background
temperature is 30 ± 7 K; if
= 0.9, the intensity
corresponds to 15 ± 3 K. The typical
spectral index of radio sources at 178 MHz is about
= 0.8.
These figures should be compared with the brightness temperature found when the source counts are integrated to the lowest flux densities observed. The integrated background emission to sub-millijansky levels corresponds to about 20 K. It is interesting to identify the principal contributors to the discrete source background on the basis of modeling the source counts. If we simply adopt the local radio luminosity function for extragalactic radio sources and assume that there was no evolution of the population with cosmic epoch, we would expect a radio background at 178 MHz of only about 1-2 K. When the effects of strong evolution of the source population is taken into account, the background emission from the evolving component of the population increases to about 16-19 K. To these components we have to add the contribution of normal galaxies which amounts to about 4 K and the low luminosity `starburst' galaxies which probably contribute a further few K to the total background.
Thus, it seems that virtually all the radio background emission can be
attributed
to discrete sources and there is not much room left for any other
contribution to the
background radio emission at low frequencies. One contribution of
possible cosmological
interest is the upper limit to the intensity of intergalactic
bremsstrahlung which would have a flat radio spectrum,
I
0. As a result, the best
limit comes from observations
at about the minimum of the radio background emission which occurs at
about 400 MHz
because at higher frequencies, the Cosmic Microwave Background Radiation
becomes
the dominant component. Once the discrete source component of the
background and
the Cosmic Microwave Background Radiation are removed, the upper limit to any
residual diffuse component would amount to about T400
MHz  0.1 K.
What all of this means is not my job - John Peacock will take up the story of the astrophysical and cosmological implications of these observations. I will end this story with two footnotes. The first is the touching story reported by Jasper Wall at the 1989 Heidelburg meeting on the Galactic and Extragalactic Background Radiation (Wall 1990). In 1964, Jasper and Donald Chu were attempting to measure the background radiation at a frequencies of 320 and 707 MHz. They found to their distress that they could not obtain the `right' answer - their background spectrum was too flat (Wall, Chu and Yen 1970). As research students, the tacit assumption was made that they had simply made some error in the calibration of their experiment. Only in the next year was the discovery of the Cosmic Microwave Background Radiation reported which accounted for their excess antenna temperature.
The second footnote concerns the extragalactic background emission at very long
wavelengths, 1 - 10 MHz. This is an even more unfashionable waveband
because the
observations are very difficult to make because of ionospheric
absorption and refraction.
However, at certain locations in the auroral zone, it is possible to
observe the sky at
10 MHz. In the 1960s Chris Purton and Alan Bridle did as good a job as could be
done at that time at these very low frequencies from the Penticton Radio
Observatory
(Bridle and Purton 1968).
The sky is still dominated by the synchrotron emission of
the Galaxy but, because of the differences in spectral indices, the
extragalactic
component is relatively more important. The process which becomes
important at these
low frequencies is bremsstrahlung absorption so that, at 10 MHz, the
Galactic plane is observed in absorption
(Purton 1966).
As observations are made at frequencies less
than 10 MHz, the distance at which the bremsstrahlung optical depth
becomes unity
decreases. The spectrum of the background radiation in the region of the
Galactic pole
has, however, been determined from the Canadian RAE1 satellite and the
shape of the extragalactic component of the background was determined
(Clark et al. 1970).
Evidence was found that the extragalactic spectrum showed a cut-off at
low frequencies,
< 3 MHz (Fig. 2).

|
Figure 2. The spectrum of the radio sky in the direction of the `north halo minimum'. The solid line shows the best fit to the total background. The dotted line shows the Galactic contribution and the dashed line the estimated extragalactic contribution, the shaded region indicating the uncertainties in the latter estimate. Independent estimates of the extragalactic background are also shown. (From Simon 1977). |
The origin of this behavior was discussed by
Simon (1977).
The obvious interpretation
of the cut-off is that it is associated with synchrotron self-absorption in the
discrete sources which make up the background. She studied the predicted
spectra of
a complete sample of 3CR radio sources to very low frequencies for which
detailed
radio structural information was available. Compact components and hot
spots become
synchrotron self-absorbed at frequencies
100 MHz and the only components which
contribute to the 1 - 10 MHz background radiation are the most diffuse
components.
Because of the strong inverse correlation between diffuse structure and
radio luminosity,
the greatest contributions to the background in the 1-10 MHz waveband come from
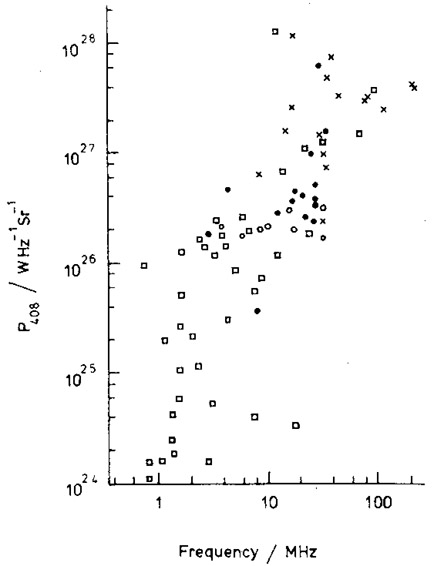
relatively low luminosity sources (Fig. 3).
Simon evaluated the predicted background
spectrum when account was taken of the cosmological evolution of these
sources and
found that she could account quite naturally for the inferred turn-over
in the isotropic radio background spectrum.
|
Figure 3. The relation between radio luminosity at 408 MHz and the frequency at which the radio source is expected to exhibit synchrotron self-absorption. The radio sources form a representative sample of the radio sources in the 3CR catalogue. (From Simon 1977). |