


The HDF-S dataset includes deep near-IR NICMOS images and the deepest
observations ever made with the STIS 50CCD imaging mode. The new galaxy
sample we use was extracted from version 1 of the HDF-S catalog created with
SExtractor
(Bertin & Arnouts 1996).
At near-IR wavelengths it consists of 425
objects detected in the J + H image, over a field of 50" x
50". The detection threshold was set to 1
 sky,
and the minimum area to 16 drizzled pixels (0.075"/pxl).
Magnitudes or upper limits in each band were computed from an area
corresponding to the limiting isophote of the J + H image.
The 50CCD (corresponding roughly to a V + I filter) STIS catalog
consists of 674 objects detected
again over a field of 50" x 50" with a detection threshold of 0.65
sky over 16 drizzled pixel
(0.025"/pxl).
Details of the data reduction, source detection algorithm, and photometry are
can be found on http://www.stsci.edu/ftp/science/hdfsouth/catalogs.html.
sky,
and the minimum area to 16 drizzled pixels (0.075"/pxl).
Magnitudes or upper limits in each band were computed from an area
corresponding to the limiting isophote of the J + H image.
The 50CCD (corresponding roughly to a V + I filter) STIS catalog
consists of 674 objects detected
again over a field of 50" x 50" with a detection threshold of 0.65
sky over 16 drizzled pixel
(0.025"/pxl).
Details of the data reduction, source detection algorithm, and photometry are
can be found on http://www.stsci.edu/ftp/science/hdfsouth/catalogs.html.
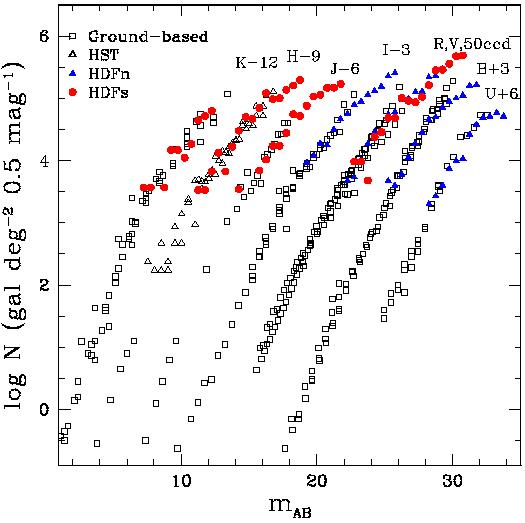
Figure 1 shows the HDF-N and -S galaxy counts compiled directly from the catalogs, as a function of AB isophotal magnitudes in the UBVIJHK bandpasses for all galaxies with signal-to-noise ratio S / N > 3 within the band. No correction for detection completeness have been made; in the HDFs the optical counts are likely to be more than 80% complete down to this limit (Williams et al. 1996). A compilation of existing HST and ground-based data is also shown. In addition to our previous compilation (Pozzetti et al. 1998), we have used J and H data from 2MASS (Chester et al. 1998), HST / NICMOS (Yan et al. 1998; Teplitz et al. 1998), NTT / SOFI (Saracco et al. 1999), and Keck / NIRC (Bershady et al. 1998). All magnitudes have been corrected to the AB system, while the second order colour corrections for the differences in the filter effective wavelengths have not been applied to the ground-based data.
| 
|
Figure 1. Left: Differential
UBVIJHK galaxy counts as a function of AB magnitudes.
The sources of the data points are given in the text. Note the decrease
of the logarithmic slope d log N/dm at faint
magnitudes. The flattening is
more pronounced at the shortest wavelengths. Right:
Extragalactic background light per magnitude bin,
(i | |
One should note that different algorithms used for ``growing'' the photometry beyond the outer isophotes of galaxies may significantly change the magnitude of faint galaxies. According to Bernstein et al. (1999), roughly 50% of the flux from resolved galaxies with V > 23 mag lie outside the standard-sized apertures used by photometric packages. An extragalactic sky pedestal created by the overlapping wings of resolved galaxies also contributes significantly to the sky level, and is undetectable except by absolute surface photometry (Bernstein et al. 1999). Also, at faint magnitude levels, distant objects which are brighter than the nominal depth of the catalog may be missed due to the (1 + z)4 dimming factor. All these systematic errors are inherent in faint-galaxy photometry; as a result, our estimates of the integrated fluxes from resolved galaxies will typically be too low, and must be strictly considered as lower limits.
 =
10-0.4(mAB+48.6) N(m), as a
function of U
(filled circles), B (open circles), V
(filled pentagons), I
(open squares), J (filled triangles), H
(open triangles),
and K (filled squares) magnitudes. For clarity, the
BVIJHK measurements
have been multiplied by a factor of 2, 6, 15, 50, 150, and 600, respectively.
=
10-0.4(mAB+48.6) N(m), as a
function of U
(filled circles), B (open circles), V
(filled pentagons), I
(open squares), J (filled triangles), H
(open triangles),
and K (filled squares) magnitudes. For clarity, the
BVIJHK measurements
have been multiplied by a factor of 2, 6, 15, 50, 150, and 600, respectively.