


In this section I shall describe the resources of information on ``integrated'' source parameters like position, flux density at one or more frequencies, size, polarisation, spectral index, etc. This information can be found in two distinct ways, either from individual source catalogues, each of which have different formats and types of parameters, or from ``object databases'' like NED, SIMBAD or LEDA (Section 4.3). The latter have the advantage of providing a ``value-added'' service, as they attempt to cross-identify radio sources with known objects in the optical or other wavebands. The disadvantage is that this is a laborious process, implying that radio source catalogues are being integrated at a slow pace, often several years after their publication. In fact, many valuable catalogues and compilations never made it into these databases, and the only way for the user to complement this partial information is to search the available catalogues separately on other servers. Due to my own involvement in providing the latter facilities, I shall briefly review their history.
4.1. The Evolution of Electronic Source Catalogues
Radio astronomers have used electronic equipment from the outset and already needed powerful computers in the 1960s to make radio maps of the sky by Fourier transformation of interferometer visibilities. Surprisingly radio astronomers have not been at the forefront of archiving their results, not even the initially rather small-sized catalogues of radio sources. It is hard to believe that the WSRT maintained one of the earliest electronic and publicly searchable archives of raw interferometer data (see www.nfra.nl/scissor/), but at the same time the source lists of 65 WSRT single-pointing surveys, published from 1973 to 1987 with altogether 8200 sources, had not been kept in electronic form. Instead, 36 of them with a total of 5250 sources were recovered in 1995-97 by the present author, using page-scanners and ``Optical Character Recognition'' (OCR) techniques.
During the 1970s, R. Dixon at Ohio State Univ. maintained what he called the ``Master Source List'' (MSL). The first version appeared in print almost 30 years ago ([Dixon (1970)]), and contained ~ 25,000 entries for ~ 12,000 distinct sources. Each entry contained the RA, DEC and flux density of a source at a given observing frequency; any further information published in the original tables was not included. The last version (#43, Nov. 1981) contained 84,559 entries drawn from 179 references published 1953-1978. The list gives ~ 75,000 distinct source names, but the number of distinct sources is much smaller, though difficult to estimate. It was typed entirely by hand, for which reason it is affected by numerous typing errors ([Andernach (1989)]). Also, it was meant to collect positions and fluxes only from new finder surveys, not to update information on already known sources.
Although the 1980s saw a ``renaissance'' of radio surveys
(e.g. MRC, B3, 6C, MIT-GB, GT, NEK, IPS in
Table 1) that decade was a
truly ``dark age'' for radio source databases
([Andernach
(1992)]).
The MSL, apart from being distributed on tape at cost, was not being
updated any more, and by the end of the 1980s there was not a single radio
source catalogue among the then over 600 catalogues available from the archives
of the two established astronomical data centres, the ``Astronomical Data
Center'' (ADC; adc.gsfc.nasa.gov/adc.html) at NASA-GSFC, and
the ``Centre de Données astronomiques de Strasbourg'' (CDS;
cdsweb.u-strasbg.fr/CDS.html). This may explain why even
in 1990 the MSL was used to search for high-redshift quasars
of low radio luminosity, simply by cross-correlating it with
quasar catalogues
([Hutchings et al. (1991)],
HDP91 in what follows).
These authors (using a version of MSL including data published up to 1975!)
noted that the MSL had 23 coincidences within 60" from QSOs
in the HB89 compilation
([Hewitt & Burbidge (1989)])
which were
not listed as ``radio quasars'' in HB89. However, HDP91 failed to note
that 13 of these 23 objects were already listed with an optical identification
in VV83, published seven years before! From the absence of weak
( 100mJy) radio
sources associated with z
100mJy) radio
sources associated with z
 2.5 quasars,
HDP91 concluded that there were no high-z quasars of low radio
luminosity. However, had the authors used the 1989 edition of VV98
([Véron-Cetty & Véron (1989)],
ADC/CDS #7126) they would have
found about ten quasars weaker than ~ 50mJy at 5-GHz,
from references published before 1989.
This would have proven the existence of the objects searched
for (but not found) by HDP91 from compilations readily available
at that time. The most recent studies by
[Bischof & Becker (1997)]
and [Hooper et al. (1996)]),
however, indicate that these objects are indeed quite rare.
2.5 quasars,
HDP91 concluded that there were no high-z quasars of low radio
luminosity. However, had the authors used the 1989 edition of VV98
([Véron-Cetty & Véron (1989)],
ADC/CDS #7126) they would have
found about ten quasars weaker than ~ 50mJy at 5-GHz,
from references published before 1989.
This would have proven the existence of the objects searched
for (but not found) by HDP91 from compilations readily available
at that time. The most recent studies by
[Bischof & Becker (1997)]
and [Hooper et al. (1996)]),
however, indicate that these objects are indeed quite rare.
Alerted by this deficiency of publicly available radio source catalogues, I initiated, in late 1989, an email campaign among radio astronomers world-wide. The response from several dozen individuals ([Andernach (1990)]) was generally favourable, and I started to actively collect electronic source catalogues from the authors. By the time of the IAU General Assembly in 1991, I had collected the tabular data from about 40 publications totalling several times the number of records in the MSL. However, it turned out that none of the major radio astronomical institutes was willing to support the idea of a public radio source database with manpower, e.g. to continue the collection effort and prepare the software tools. As a result, the EINSTEIN On-line Service (EINLINE or EOLS), designed to manage X-ray data from the EINSTEIN satellite, offered to serve as a testbed for querying radio source catalogues. Until mid-1993 some 67 source tables with ~ 523,000 entries had been integrated in collaboration with the present author ([Harris et al. (1995)]). These are still searchable simultaneously via a simple telnet session (telnet://einline@einline.harvard.edu). However, in 1994 NASA's funding of EOLS ceased, and no further catalogues have been integrated since then. A similar service is available from DIRA2 (www.ira.bo.cnr.it/dira/gb/), providing 54 radio catalogues with 2.3 million records, including older versions of the NVSS and FIRST catalogues, as well as many items from the present author's collection. However, due to lack of manpower, DIRA's catalogue collection is now outdated, and many items from Table 1 are missing. In late 1993, Alan Wright (ATNF) and the present author produced a stand-alone package (called ``COMRAD'') of 12 major radio source catalogues with some 303,600 entries. It comes with dBaseIV search software for PCs and can still be downloaded from URL wwwpks.atnf.csiro.au/databases/surveys/comrad/comrad.html. Several other sites offer more or less ``random'' and outdated sets of catalogues (a few radio items included) and are less suitable when seeking up-to-date and complete information. Among these are ESO's STARCAT (arch-http.hq.eso.org/starcat.html), ASTROCAT at CADC (cadcwww.dao.nrc.ca/astrocat), and CURSA within the Starlink project (www.roe.ac.uk/acdwww/cursa/home.html). CURSA is actually designed to be copied to the user's machine, and to work with local catalogues in a CURSA-compatible format.
From late 1989 until the present, I have continued my activities of collecting source catalogues, and since 1995, I have also employed OCR methods to convert printed source lists into electronic form, among them well-known compilations such as that of [Kühr et al. (1979)] of 250 pages, for which the electronic version had not survived the transition through various storage media. Recovery by OCR requires careful proof-reading, especially for those published in tiny or poorly printed fonts (e.g. Harris & Miley (1978), [Walterbos et al. (1985)], and [Bystedt et al. (1984)]). In many cases the original publications were impossible to recover with OCR. For some of these I had kept preprints (e.g. for [Tabara & Inoue (1980)]) whose larger fonts facilitated the OCR. Numerous other tables (e.g. [Braude et al. (1979)], [Quiniento et al. (1988)] or [Altenhoff et al. (1979)]) were patiently retyped by members of the CATS team (see below). Since about 1996, older source tables are also actively recovered with OCR methods at CDS. Unfortunately, due to poor proof-reading methods, errors are found quite frequently in tables prepared via OCR and released by CDS. Occasionally, tables were prepared independently by two groups, allowing the error rate to be further reduced by inter-comparison of the results. Up to now, radio source tables from 177 articles with a total of 75,000 data records and many thousand lines of text (used as documentation for the tables) were prepared via OCR, mostly by the present author. Surprisingly, about half of the tables (including those received directly from the authors) show some kind of problem (e.g. in nomenclature, internal consistency, or formatting, etc.) that requires attention, before they are able to be integrated into a database or searchable catalogue collection. This shows, unfortunately, that not enough attention is paid to the data section by the referees of papers. While this section may appear uninteresting to them, one should keep in mind that in future re-analyses based on old published data, it is exactly the data section which remains as a heritage to future researchers, and not the interpretations given in the original papers. In the early 1990s, most of the tables were received from the original authors upon request, but currently about half of the tables can be collected from the LANL/SISSA electronic preprint server (xxx.lanl.gov). However, this has the danger that they may not be identical to the actual publication. The vast majority of tabular data sets are received in TEX format, and their conversion to ASCII requires substantial efforts.
Currently my collection of radio source lists (cats.sao.ru/~cats/doc/Andernach.html) contains source lists from 500 articles, but only ~ 22% of the tables are also available from ADC or CDS (Section 4.2). While the collection started in 1989, half the 500 data sets were collected or prepared since 1996, and the current growth rate is ~ 80 data sets per year. About three dozen further source lists exist in the CDS archive (Section 4.2), most of which are either from the series of nine AAS CDROMs, issued twice a year from 1994 to 1997 with tables from the ApJ and AJ journals, or from recent volumes of the A&AS journal, thanks to a 1993 agreement between the Editors of A&AS and CDS to archive all major tables of A&AS at the CDS. Unfortunately such an agreement does not exist with other journals, for which reason my collection efforts will probably continue until virtually all astronomical journals provide electronic editions. Presently some tabular data (e.g. in the electronic A&A) are offered only as images, while other journals offer only hypertext versions of their tables, which frequently need further treatment to be converted to plain ASCII format, required for their ingestion into databases.
The size distribution of electronic radio source catalogues (including my collection and that of CDS) is plotted in the left panel of Figure 6. For catalogues with more than ~ 200 entries the curve follows a power law with index near -0.6, a manifestation of Zipf's law in bibliometrics ([Nicholls (1987)]). The decline for smaller catalogues is due to the fact that many of them simply do not exist in electronic form. In the right panel of Fig. 6 the growth over time of the cumulative number of records of these catalogues is plotted. The three major increases are due to the MSL in 1981, to the 87GB/GB6/PMN surveys in 1991, and, more recently, to the release of NVSS, FIRST and WENSS in 1996/97.

|
Figure 6.
Left: Size distribution of radio source catalogues
available in electronic form. R is the number of records in
a source catalogue, and N( |
Already, since the early 1990s, the author's collection of radio catalogues has been the most comprehensive one stored at a single site. However, the problem of making this heterogeneous set of tables searchable with a common user interface was only solved in 1996, when the author started collaborating with a group of radio astronomers at the Special Astrophysical Observatory (SAO, Russia), who had built such an interface for their ``Astrophysical CATalogs support System'' (CATS; Section 4.2). Their common interests in radio astronomy stimulated the ingestion of a large number of items from the collection. By late 1996, CATS had surpassed EOLS in size and scope, and in mid-1997 an email service was opened by CATS, allowing one to query about 200 different source lists simultaneously for any number of user-specified sky positions, with just a single and simple email request.
4.2. Searching in Radio Catalogues: VizieR and CATS
The largest collections of astronomical catalogues, and published tabular data in general, are maintained at the CDS and ADC. The ``Astronomer's Bazaar'' at CDS (cdsweb.u-strasbg.fr/Cats.html) has over 2200 catalogues and tables for downloading via anonymous ftp. The full list of items (ftp://cdsarc.u-strasbg.fr/pub/cats/cats.all) may be queried for specific catalogues by author name, keyword, wavelength range, or by name of (space) mission. At NASA's ADC (adc.gsfc.nasa.gov/adc.html) a similar service exists. Despite the claims that ``mirror copies'' exist in Japan, India and Russia, CDS and ADC are the only ones keeping their archives current. Both have their own catalogue browsers: VizieR at CDS (vizier.u-strasbg.fr/cgi-bin/VizieR), and Catseye at ADC (tarantella.gsfc.nasa.gov/catseye/ViewerTopPage.html), but currently none of them allows one to query large numbers of catalogues at the same time, although such a system is in preparation within VizieR at the CDS. Presently ~ 200 catalogues appear when VizieR is queried for the waveband ``radio''. This includes many lists of HII regions, masers, etc., but excludes many of the major radio continuum surveys listed in Table 1. For radio source catalogues, the CATS system currently has the largest collection, and CATS is definitely preferable when radio continuum data are needed.
The CATS system (cats.sao.ru) currently permits searches through about 200 radio source catalogues from about 150 different references, with altogether over 3 million entries, including current versions of the NVSS, FIRST and WENSS catalogues. Many further radio source lists are available via anonymous FTP, as they have not yet been integrated into the search facility (e.g. when only source names, and not positions, are given in the available electronic version of the catalogue). Documentation is available for most of the source lists, and in many cases even large parts of the original paper text were prepared from page scans.
Catalogues in CATS may be selected individually from cats.sao.ru/cats_search.html, or globally by wavelength range. One may even select all searchable catalogues in CATS (including optical, IR, X-ray), making up over 4 million entries. They may be searched interactively on the WWW, or by sending a batch job via email. To receive the instructions about the exact format for such a batch request, send an empty email to cats@sao.ru (no subject required). The output can be delivered as a homogeneous table of sources from the different catalogues, or each catalogue in its native format. The latter assures that all columns as originally published (but not included in the homogenised table format) may be retrieved, although currently the user has to check the individual catalogue documentation to find out what each column means. With the select option one may retrieve sources from a single sky region, either a rectangle or a circle in different coordinate systems (equatorial B1950 or J2000, or Galactic), while the match option allows a whole list of regions to be searched in order to find all the objects in each region. It is then the responsibility of the user to find out which of these data represent the object (or parts of an object, depending on the telescope characteristics) and may be used for inter-comparisons.
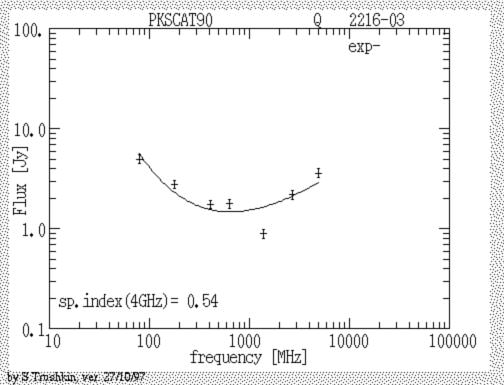
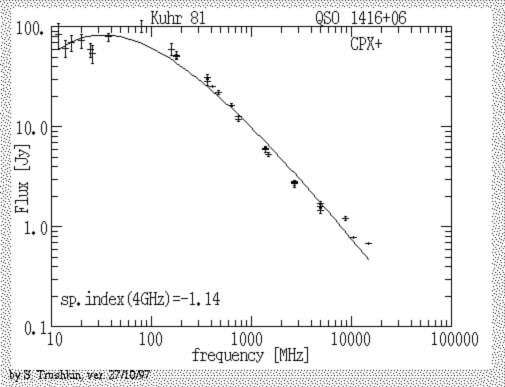
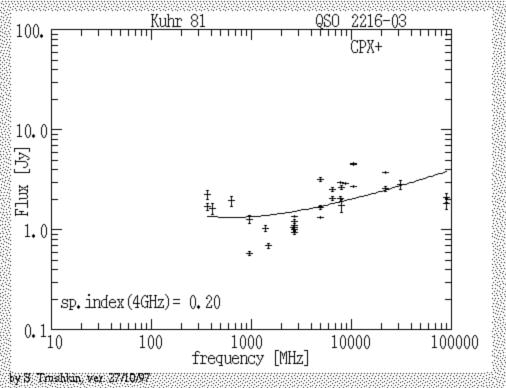
CATS offers a few other useful features. For several multi-frequency radio catalogues (or rather compilations of radio sources) CATS allows radio spectra to be plotted on-the-fly, e.g. for [Kühr et al. (1979)], [Kühr et al. (1981)], ([Otrupcek & Wright (1991)], =PKSCAT90), [Trushkin (1996)], [Kallas & Reich (1980)], [Bursov et al. (1997)]. Various options for fitting these spectra and weighting the individual flux errors are provided. Examples for two sources are shown in Fig. 7. Note that PKSCAT90 includes data obtained at only one epoch per frequency, while the Kühr compilations include several epochs at a given frequency. Therefore the variability of QSO2216-03 (= PKSB2216-038) becomes obvious only in the lower right panel of Fig. 7.

| 
|
| 
|
Figure 7. Radio Spectra of the two PKS sources PKS1416+06 (left) and PKS2216-03 (right) plotted with CATS. Upper row: data from PKSCAT90 (one epoch per frequency); lower row: data from the multi-epoch compilation by Kühr et al. (1981). | |
Note that CATS (at least at present) is a searchable collection of catalogues, and not a relational database, i.e. no cross-identifications have yet been made between catalogues (except for a few, which resulted in yet other catalogues). However, given its vastly larger collection of radio source data, it is an indispensable tool that complements the information on radio sources found e.g. in NED or SIMBAD.
In future it is planned that the user may display both the sky distribution and a spectral energy distribution (radio spectrum) of all entries found for a (sufficiently narrow) positional search. The sky plot will indicate the angular resolution, the positional error box, and (if available) the shape of each catalogued source, so that the user may interactively discard possibly unrelated sources, and arrive at the radio spectrum of the object of interest, as mentioned by [Verkhodanov et al. (1997)].
4.3. Object Databases: NED, SIMBAD, and LEDA
These databases have already been described in my tutorial for this winter school, so I shall concentrate here on their relevance for radio astronomy. All three databases were originally built around catalogues of optical objects (galaxies in the case of NED and LEDA, and stars in the case of SIMBAD). It is quite natural that information on otherwise unidentified radio sources is not their priority. Also, being an extragalactic database, NED tends to provide more information on radio sources than SIMBAD, which was originally dedicated to stars, which constitute only a negligible population of radio continuum sources in the sky. The fact that before being included into NED or SIMBAD, every new (radio or other) source has to be checked for its possible identification with another object already in these databases, implies that the integration of large catalogues may take years from their publication. The rightmost column of Table 1 gives an idea of this problem. A further obstacle for database managers is that they have to actively collect the published data from the authors or other resources. If you wish to see your data in databases soonest, the best thing is to send them (preferably in plain ASCII format) to the database managers directly after publication.
SIMBAD is accessible via password from simbad.u-strasbg.fr/Simbad, and has its priority in maintaining a good bibliography for astronomical objects (not necessarily those detected as a radio source only). NED can be accessed freely through the URL nedwww.ipac.caltech.edu and tends to make an effort to also populate its various ``data frames'' (like optical magnitude, fluxes at various frequencies, etc.) with recently published measurements.
Searches by object name rely on rather strict rules. In databases these may not always conform to IAU recommendations (cdsweb.u-strasbg.fr/iau-spec.html), mainly due to deviations from these recommendations by individual authors. In case of doubt about the exact name of a source, it is wise to start searching the databases by position.
The ``Lyon-Meudon Extragalactic Database'' (LEDA;
www-obs.univ-lyon1.fr/leda)
is primarily intended for studying the kinematics of the local
Universe, and as such has little interest
in radio continuum data on galaxies. However, LEDA is the ideal place to
look for integrated neutral hydrogen (HI) data of nearby
(z 0.2)
galaxies. These HI measurements play an important role
for distance estimates of galaxies, independent of their radial velocities.
This allows their ``peculiar motions'' to be calculated, i.e. the
deviations of their radial velocities from the Hubble law.
Finally, one should keep in mind that SIMBAD and NED started to include references on extragalactic objects only since 1983 and 1988 respectively, although a few major references before these dates have now been included. In the following I give just one example in which the consequences of this have not been considered by users of NED or SIMBAD. The X-ray source RXJ15237+6339 was identified (from NED) with the radio source 4C+63.22 by [Brinkmann & Siebert (1994)], and these authors comment that ``One object (4C+63.22) is classified as `Radio Source' only in the NED data base, so, strictly speaking, it belongs to the class of unidentified objects.'' However, according to VV83 (their ref.603 = [Porcas et al. (1980)]) the source 4C+63.22 had actually been identified with an 18.5m galaxy. This object is within 5" of the brightest source in the NVSS catalogue within a radius of 90". However, the NVSS map shows a large triple radio galaxy with a North-South extent of ~ 4'. Later re-observation at 5GHz with the VLA at 1.3" resolution ([Laurent-Muehleisen et al. (1997)]) detected only a radio core coincident with a 16.6m object which the 1980 authors had already mentioned in their notes as 1' offset from their prime candidate identification for the source 1522+638. I should add that the data table of the 1980 paper was published on microfiche.
 R)
is the number of radio source catalogues with R records or more.
The bottom right corner corresponds to the NVSS catalogue. Right: The
growth in time of the number of continuum radio source
measurements. Y is the year of publication of a radio source
catalogue, and N(
R)
is the number of radio source catalogues with R records or more.
The bottom right corner corresponds to the NVSS catalogue. Right: The
growth in time of the number of continuum radio source
measurements. Y is the year of publication of a radio source
catalogue, and N( Y) is the
cumulative number of records (in millions) contained in
catalogues published up to and including year Y.
Y) is the
cumulative number of records (in millions) contained in
catalogues published up to and including year Y.