


6.1. Radio Observatories and their Archives
A list of 70 radio astronomy centres with direct links to their WWW pages has been compiled at www.ls.eso.org/lasilla/Telescopes/SEST/html/radioastronomy/index.html, and the URL www.mso.anu.edu.au/~anton/astroweb/astro_radio.html presents links to 65 radio telescopes. Further WWW sites of radio observatories may be found on AstroWeb (www.cv.nrao.edu/fits/www/astronomy.html), searching for ``Telescopes'' or ``Radio Astronomy''.
A recent inquiry by E. Raimond of NFRA revealed the following (priv.comm., cf. also www.eso.org/libraries/iau97/commission5.html).
6.1.1. Archives of Centimetre- and Metre-wave Telescopes/Arrays
For the 305-m antenna at Arecibo (Puerto Rico; www.naic.edu/) all data were kept, some still on reel-to-reel magnetic tapes, but no catalogue is available remotely. A catalogue of projects is searchable with the help of the staff.
Data obtained at the Effelsberg 100-m telescope of the Max-Planck Institut für Radioastronomie (MPIfR) at Bonn, Germany (www.mpifr-bonn.mpg.de/index_e.html) were originally archived only for the five years prior to the overwriting of the storage medium. Presently data are archived on CD-ROMs, but these are not accessible to the outside world. There is no public observations catalogue on-line, and help from staff is required to work with data taken with the 100-m antenna.
The ``Australia Telescope National Facility'' (ATNF) has archived all raw data of its ``Compact Array'' (ATCA; www.narrabri.atnf.csiro.au/). Observations and project databases are available at www.atnf.csiro.au/observers/data.html.
The ATNF Parkes 64-m telescope, despite its 27 years of operation, has no data archive so far. The multibeam HI surveys (Section 6.4.1), just started, will be archived, and results will be made public.
At the ``Dominion Radio Astronomy Observatory'' (DRAO; www.drao.nrc.ca) raw and calibrated data are archived. Observatory staff will assist in searching the observations catalogue. Results of the Galactic Plane Survey (in progress, Section 8.1) will be made available publicly via the CADC.
The Molonglo Observatory (www.physics.usyd.edu.au/astrop/most/) has archived its raw data. In general, data can be retrieved via collaborations with staff. Results of recently started surveys (Section 3.7.4, Section 8.1) will be made publicly available.
The archive of NRAO's Very Large Array contains data from 1979 to the present (excluding 1987) and can be interrogated at http://www.aoc.nrao.edu/vla/vladb/VLADB.html. Data are reserved for the observing team for 18 months following the end of the observations. Archive data after this period must be requested from either the Assistant Director or the Scheduler at the VLA.
The Netherlands Foundation for Research in Astronomy (NFRA) keeps an archive of all the raw data ever taken with the Westerbork Synthesis Radio Telescope (WSRT), an aperture synthesis telescope of 14 antennas, of 25-m diameter, in the Netherlands. At URL www.nfra.nl/scissor/ one may browse this archive by various criteria (RA, DEC, frequency, observation date, etc.) and even formulate a request to obtain the data. Note that you need to specify a username and password (both ``guest'') before you may query the database. However, special auxiliary files will be needed to reduce these data e.g. with AIPS. For the processed results of the WENSS survey, see Section 3.7.1.
The ``Multi-Element Radio-Linked Interferometer'' (MERLIN), in the UK, has all raw data archived since MERLIN became a National Facility in 1990. The catalogue of observations older than 18 months is searchable on position and other parameters (www.jb.man.ac.uk/merlin/archive). For the actual use of archived data, a visit to Jodrell Bank is recommended in order to get the processing done properly.
6.1.2. Archives of (Very) Long Baseline Interferometers
At the ``Very Long Baseline Array'' (VLBA; www.nrao.edu/doc/vlba/html/VLBA.html) in the USA, all correlated data are archived, and the observations catalogue may be retrieved from www.nrao.edu/ftp/cumvlbaobs.txt. (When I inquired about the latter URL, the reply came with a comment: ``I'm not sure any URL is sufficiently permanent to be mentioned in a book.'')
The ``European VLBI Network'' (EVN) has its correlated data archived at MPIfR Bonn, Germany, so far. A catalogue of observations is available (Section 5.2), but the data are not in the public domain. Once the correlator at the ``Joint Institute for VLBI in Europe'' (JIVE) becomes operational, archiving will be done at Dwingeloo (www.nfra.nl/jive). A general problem is that in order to re-analyse archived data, calibration data are also needed, and these are not routinely archived.
The US Naval Observatory (USNO) has made VLBI observations for geodetic and reference frame purposes for more than a decade. Among other results, these lead to the latest estimates of the precession and nutation constants (maia.usno.navy.mil/eo/Section 5.2) contains all of the images available from the Geodetic/Astrometric experiments, including the VLBA. Almost all of these VLBA observations have been imaged. However, the USNO Geodetic/Astrometric database is huge, and the large, continuing project of imaging has been only partially completed. Examples of archival use of the Washington VLBI Correlator database can be found in [Tateyama et al. (1998)] and references therein.
6.1.3. Millimetre Telescopes and Arrays
The ``Berkeley-Illinois-Maryland Association'' (BIMA, bima.astro.umd.edu/bima/, [Welch et al. (1996)]) maintains a millimetre array which has no formal archiving policy. However, there is a searchable observatory archive of raw data. To request authorisation for access, visit the page bima-server.ncsa.uiuc.edu/bima/secure/bima.html.
At the ``Caltech Millimeter Array'' (www.ovro.caltech.edu/mm/main.html) all observed data are in a database. Searching requires the help of the staff, because it is not easy to protect proprietary data in another way.
The ``Institut de RadioAstronomie Millimétrique'' (IRAM) maintains the 30-m dish at Pico Veleta (Spain, iram.fr/PV/veleta.html), and the ``Plateau de Bure Interferometer'' (PDBI; iram.fr/PDBI/bure.html). The raw data from the PDBI are archived, but so far the observation catalogues are made available only via Newsletter and e-mail. Web-access is bein considered for the future. The P. de Bure archive is only accessible within iram.fr, the IRAM local network. The only external access to the P.de Bure archive is to pull up the observations list month by month (from 1990 to the present) from the page iram.fr/PDBI/project.html.
The ``James-Clerk-Maxwell Telescope'' (JCMT; www.jach.hawaii.edu/JCMT/) on Mauna Kea (Hawaii) has its raw and processed data archived at the Canadian Astronomy Data Center (CADC; cadcwww.dao.nrc.ca/jcmt/).
The ``Caltech Sub-mm Observatory'' (CSO; www.cco.caltech.edu/~cso/) is a 10.4-m sub-mm dish on Mauna Kea (Hawaii) in operation since 1988. Its archive can be reached via the URL puuoo.submm.caltech.edu/doc_on_vax/html/doc/archive.html.
The ``Nobeyama Millimetre Array'' (NMA; www.nro.nao.ac.jp/NMA/nma-e.html) and the Smithsonian Sub-mm Array (SMA; sma2.harvard.edu/) have their archives in the software development stage.
In conclusion, archiving in radio astronomy is far from optimal, but not too bad either. Most major radio observatories have an archive of some sort, and accessibility varies from excellent to usable. Some observatories could advertise their archives better, e.g. on their own Web-pages, or by registering it in AstroWeb's links. Most importantly, these archives are very little used by astronomers, and would be well worth many (thesis) projects, e.g. to study source variability over more than a decade. The following section gives some hints on where to start searching when software is needed to reduce some of the raw data retrievable from the Internet.
6.2. Software for Radio Astronomy
As are the observing techniques for radio astronomy, its data reduction methods are much more diverse than those in optical astronomy. Although AIPS (www.cv.nrao.edu/aips) has been the dominating package for radio interferometer data, many other packages have been developed for special purposes, e.g. GILDAS, GREG, & CLASS at IRAM (iram.fr/GS/gildas.html), Analyz at NAIC (ftp://naic.edu/pub/Analyz), GIPSY at Groningen (ftp://kapteyn.astro.rug.nl/gipsy/), Miriad by the BIMA and ATNF staff (www.atnf.csiro.au/computing/software/miriad/), and Karma at ATNF (ftp://ftp.atnf.csiro.au/pub/software/karma/). A comprehensive compilation of links can be found from the AstroWeb at www.cv.nrao.edu/fits/www/yp_software.html. The ``Astronomical Software and Documentation Service'' (ASDS; asds.stsci.edu/) contains links to the major astronomical software packages and documentation. It allows one to search for keywords in all the documentation files available.
A complete rewrite of the AIPS package from Fortran to C++ code, known as the AIPS++ project (aips2.nrao.edu/aips++/docs/html/aips++.html), has been under way since mid-1991.
A note on preparing radio-optical overlays with AIPS: With the public availability of 2-dimensional maps from radio (NVSS, FIRST, WENSS) and optical (DSS) surveys, it is relatively easy to prepare radio-optical overlays for identification or publication purposes. Radio and optical maps of similar size should be culled in FITS format from the WWW. To identify the coordinate system of a map, AIPS looks for the FITS-header keyword ``EPOCH'' rather than ``EQUINOX'' (which is one of the very few bugs in the FITS definition!). Maps from SkyView (e.g. DSS and NVSS) seem to lack the EPOCH keyword in their FITS header, thus AIPS assumes(!) them to be of equinox 1950.0. (Both FIRST and NVSS maps, when taken from their home institutions, STScI and NRAO, respectively, do have the EPOCH keyword properly set.) Thus, for AIPS to work correctly on SkyView maps, it is necessary to introduce the proper ``EPOCH'' value in the map headers. This may be done with gethead and puthead in AIPS. Then, one of the maps (usually the one with the coarser pixel size) has to be prepared for re-gridding to the grid of the map with the finer pixel size. This preparation may be done with EPOSWTCH, before the actual re-gridding is done with HGEOM. Finally the task KNTR permits one to plot one of the maps (usually the optical) in greyscale, and the other as contours (usually the radio map). However, for more sophisticated combined plots of greys and contours (including white contours), other software packages (Section 6.2) allow finer artwork to be produced.
6.3. Radio Images on the Internet
Here we have to distinguish between images extracted from large-scale surveys, and images of individual sources. Both types will be discussed in the following two subsections.
6.3.1. Images from Large-scale Surveys
I had already mentioned (Section 3.7) that the very large-scale radio surveys like NVSS, FIRST, and WENSS offer (or are in the process of developing) so-called ``postage-stamp servers'', i.e. WWW interfaces where desired pieces of the 2-dimensional maps may be extracted, either in gif format, or, if one needs to work with the data, in the (usually about 10 times larger) FITS format. For the retrieval of large lists of small images, typically for identification projects, it is worth noting that several sites offer scripts (mostly based on perl) which allow the retrieval of these maps ``from the command line'', i.e. without even opening a WWW browser! The source list and map sizes may be pre-edited locally within a sequence of commands which are run in background (e.g. during the night, if necessary), and which will save the requested maps as files with names of the user's choice. For the NVSS, these may be obtained from W. Cotton (bcotton@nrao.edu) or from skyview.gsfc.nasa.gov/batchpage.html. For FIRST images look at http://sundog.stsci.edu/first/images.html, or use the lynx browser from the command line (consult R. White at rlw@stsci.edu in case of doubt).
FIRST and NVSS have mirror sites for their data products at the ``Mullard Radio Astronomical Observatory'' (MRAO, Cambridge, UK; www.mrao.cam.ac.uk/surveys), to allow faster access from Europe. Presently only part of the FIRST maps (and not the FIRST source catalogue) are available from there. Make sure that the piece of information you need is included at this site before concluding that it has not been observed.
A number of large-scale radio surveys are accessible from NASA's
SkyView
facility (skyview.gsfc.nasa.gov/).
These are the 34.5MHz survey with the GEETEE telescope in India
([Dwarakanath & Udaya Shankar (1990)]),
the 408MHz all-sky survey
(Haslam et al. 1982),
the 1.4GHz Stockert 25-m dish surveys
([Reich (1982)],
[Reich & Reich (1986)]),
FIRST and NVSS at 1.4GHz (see Section 3.7), and
the 4.85GHz surveys of 1986+87 with the Green Bank 300-ft telescope
([Condon et
al. (1994)]),
as well as their southern counterparts
made with the Parkes 64-m dish (PMN;
[Condon et
al. (1993)]).
A 4.85GHz survey made with the NRAO 140-ft antenna (covering
0h < RA < 20h, -40° <
 < +5° ) is also available
([Condon et
al. (1991)]).
Descriptions of the surveys accessible from Skyview can
be found at URL skyview.gsfc.nasa.gov/cgi-bin/survey.pl.
< +5° ) is also available
([Condon et
al. (1991)]).
Descriptions of the surveys accessible from Skyview can
be found at URL skyview.gsfc.nasa.gov/cgi-bin/survey.pl.
An attempt to list some of the survey work at radio wavelengths in both hemispheres was made with the page ``Radio Surveys of the Southern and Northern Sky'' (wwwpks.atnf.csiro.au/databases/surveys/surveys.html). Links to the data from these surveys are included, where available.
Extractions from the large-scale surveys made at MPIfR Bonn can be retrieved interactively from the URL www.mpifr-bonn.mpg.de/survey.html, including polarisation maps (Stokes Q and U) of the Galactic plane at 2.7GHz.
The WSRT has been used to survey a section of the Galactic plane
at 327MHz
([Taylor et
al. (1996)]).
The region
43° <  < 91° ,
|b| < 1.6° was covered with 23 overlapping fields.
Each field was observed at two epochs, several years apart, to
identify variable sources. Combined intensity maps from
both epochs, having a sensitivity of typically a few mJy and
angular resolution of 1' × 1'
csc(),
may be viewed or retrieved as FITS images from the URL
www.ras.ucalgary.ca/wsrt_survey.html.
< 91° ,
|b| < 1.6° was covered with 23 overlapping fields.
Each field was observed at two epochs, several years apart, to
identify variable sources. Combined intensity maps from
both epochs, having a sensitivity of typically a few mJy and
angular resolution of 1' × 1'
csc(),
may be viewed or retrieved as FITS images from the URL
www.ras.ucalgary.ca/wsrt_survey.html.
The Hartebeesthoek Radio Astronomy Observatory (HartRAO) has used
its 26-m dish at 2.3GHz to map 67% of the southern sky
(0h <  <
12h, -80° <
< +13° ;
12h < <
24h,-83° <
< +32° ) with an angular
resolution of 20'
([Jonas et
al. (1998)]).
Until now this is the
highest frequency at which such large areas have been mapped, while
preserving large-scale emission features.
To see a combination with northern sky surveys,
go to www.ru.ac.za/academic/departments/physics/frameset.html,
and click on ``Radio Astronomy Group''.
Survey maps are available at
ftp://phlinux.ru.ac.za/pub/survey (or contact J.Jonas at
phjj@hippo.ru.ac.za).
<
12h, -80° <
< +13° ;
12h < <
24h,-83° <
< +32° ) with an angular
resolution of 20'
([Jonas et
al. (1998)]).
Until now this is the
highest frequency at which such large areas have been mapped, while
preserving large-scale emission features.
To see a combination with northern sky surveys,
go to www.ru.ac.za/academic/departments/physics/frameset.html,
and click on ``Radio Astronomy Group''.
Survey maps are available at
ftp://phlinux.ru.ac.za/pub/survey (or contact J.Jonas at
phjj@hippo.ru.ac.za).
The southern Galactic plane has been surveyed with the Parkes 64-m dish
at 2.42GHz
([Duncan et
al. (1995)]).
The region 238° <
< 5° ,
|b| < 5° was mapped with 10.4' resolution. The polarisation
data of that survey have been published in
[Duncan et al. (1997)],
and are accessible from
www.physics.uq.edu.au/people/duncan/.
With a noise level of ~ 17mJy/beam in total intensity, and
5-8mJy/beam in Stokes Q and U, it is currently the most sensitive
southern Galactic plane survey. Its sensitivity to
extended ( 30') low surface
brightness structures is 3-5
times better than a 12-h synthesis with MOST or ATCA. It is
able to detect SNRs of up to 20° in size. Since the ratio
of the size of the maximal structure detectable to angular resolution
is the same as for the MGPS (Section 8.1), they
are complementary surveys.
30') low surface
brightness structures is 3-5
times better than a 12-h synthesis with MOST or ATCA. It is
able to detect SNRs of up to 20° in size. Since the ratio
of the size of the maximal structure detectable to angular resolution
is the same as for the MGPS (Section 8.1), they
are complementary surveys.
The IAU (Comm. 9) Working Group on Sky Surveys (formerly ``Wide Field Imaging'') offers a ``butterfly'' collection of links to sky surveys in radio and other wavebands at pixela.stsci.edu/iauwg/survey_url.html. Some images of outstanding radio sources in the sky are clickable from an all-sky radio map at www.ira.bo.cnr.it/radiosky/m.html (in Italian).
6.3.2. Image Galleries of Individual Sources
The NED database has radio images linked to some of their objects, typically bright radio galaxies from the 3C catalogue. The ``Astronomy Digital Image Library'' (ADIL; imagelib.ncsa.uiuc.edu/imagelib) at the National Center for Supercomputing Applications (NCSA) offers a search interface by coordinates, object name, waveband, and other criteria. However, it is not clear from the start how many and what kind of radio images one may expect.
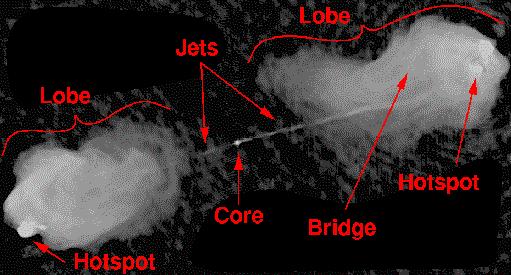
In an attempt to more adequately describe the phenomenon of classical double radio sources, [Leahy (1993)] coined the term ``Double Radiosource Associated with Galactic Nucleus'' (DRAGN) for these objects (Fig. 8). A gallery of images of the 85 nearest DRAGNs is available in the interactive ``Atlas of DRAGNs'' ([Leahy et al. (1998)]) at www.jb.man.ac.uk/atlas/. Apart from high-resolution images, the Atlas gives extensive explanations and references on the physical processes involved. The gallery of icons which has the objects sorted by their radio luminosity is especially instructive as a demonstration of the well-established transition from ``Fanaroff-Riley'' class I (FRI) for low-luminosity objects to FRII for high-luminosity ones. The editors of the Atlas are planning to publish their work after reducing new data of objects for which the published maps are as yet inadequate. The maps may be downloaded in FITS format, which allows a number of analyses to be performed on them, at will.
|
Figure 8. A 4.9GHz image of CygnusA (3C405) at 0.4'' resolution, taken with all four configurations of the VLA, and showing the typical ``ingredients'' of a DRAGN (from Leahy et al. (1998), courtesy R.Perley, C.Carilli & J.P. Leahy). The overall size of the source is 2arcmin, while the optical galaxy is ~ 20'' in size on DSS, and coincides with the radio core. |
More than a decade after its commissioning, the VLA has been equipped with low-frequency receivers at 74 and 330MHz. At these frequencies, the field of view is so wide that the sky can no longer be approximated by a 2-dimensional plane, and 3-dimensional Fourier transforms are necessary to produce meaningful images. Some examples are given at rsd-www.nrl.navy.mil/7214/weiler/4bandfarm.html.
There is a general scarcity of WWW resources on spectral line data. Integrated source parameters may be obtained from selected catalogues in the CDS archive, most conveniently consulted via vizier.u-strasbg.fr/cgi-bin/VizieR.
A list of transition frequencies from 701MHz to 3.43THz, with references, has been published by [Lovas (1992)]. A compilation of links to ``Worldwide Molecular Astrophysics Resources'' is offered at www.strw.leidenuniv.nl/~iau34/links.html. It provides pointers to several useful mm-wave line databases. The first of these links (dated June 1997) tells us that 114 molecules have now been detected in space, containing between two and thirteen atoms (HC11N). One may search for known spectral lines by several parameters (frequency range, type of molecule, line strength, etc.) at the URLs spec.jpl.nasa.gov/ftp/pub/catalog/catform.html and monet.astro.uiuc.edu/~dmehring/find_lines.1.0.html.
By the 1950s, radio astronomers had already mapped the profiles of the hyperfine transition of the ground state of the hydrogen atom at 1420MHz (21.1cm). From this they could infer, using the formulae by Lindblad & Oort for differential Galactic rotation, the spiral structure of the HI distribution in the northern ([Westerhout (1957)]), and later in both Galactic hemispheres (e.g. [Oort et al. (1958)]).
Later these surveys were extended beyond the Galactic plane to the
whole sky, and apart from their importance for the distribution and
kinematics of Galactic HI, they are also a necessary tool for X-ray
astronomers to estimate the Galactic absorption (from the HI column
density) in X-ray spectra of extragalactic objects, near ~ 0.1keV.
Many of these HI surveys are now available in the CDS archive
(e.g. catalogues VIII/7, 8, 9, 10, 11, and 47).
Curiously, some of these ``treasures'', e.g. the ``Bell Laboratories
HI Survey'' by Stark et al. (1990; CDS/ADC #VIII/10) were never
really published in an ordinary journal. Others, like VIII/47
([Westerhout et al. (1982)])
are only now being prepared for integration
into the CDS archive, 16 years after publication. The HI survey by
[Strong et
al. (1982)]
was tracked down by the author, motivated by a poster displayed on the current
winter school, and later found to exist in electronic form! These authors
used the Parkes 64-m dish to cover a Galactic plane region
( = 245° through 12° ,
|b| < 10°), sampled every
0.5° in and 1° in
b with an angular resolution of 15'.
One of the largest very recent HI surveys is indeed available
electronically, but not in a public archive.
Between 1988 through 1993 the sky north of
= -30° was mapped with the
Dwingeloo 25-m dish (HPBW = 36') on a grid of 30' and with a
velocity coverage
of 850 kms-1. The data resulting from this
Leiden-Dwingeloo HI Survey
are not presently available on the Internet, but were published as an Atlas
and a CD-ROM
([Hartmann &
Burton (1997)]).
On the CD, there are colour GIF files for all images in the Atlas, as well
as animations running through the data cube in velocity space.
Integrated HI fluxes and line widths of galaxies may be obtained from LEDA, accessible via telnet to lmc.univ-lyon1.fr (login as leda), or enter via the WWW at www-obs.univ-lyon1.fr/leda. Currently LEDA offers HI fluxes for ~ 12,400 of a total of ~ 170,000 galaxies in LEDA.
HI observations of external galaxies (mainly the gas-rich late-type ones) are important for deriving their rotation curves and detailed kinematics (e.g. [Burton (1976)]). These (flat) rotation curves have led to further evidence for the so-called ``dark matter haloes'' in galaxies. Numerous detailed studies have been published over the past three decades, very little of which has been preserved in electronic form, except for compilations of rotation curve parameters (e.g. [Baiesi-Pillastrini et al. (1983)], [Persic & Salucci (1995)] and [Mathewson & Ford (1996)]). Also, [Martín (1998)] gives a compilation of bibliographic references to HI maps of 1439 galaxies published between 1953 and 1995, as well as parameters drawn from these maps.
A gallery of ATCA observations of HI in galaxies has been compiled by B. Koribalski at www.atnf.csiro.au/~bkoribal/atca_obs.html.
6.4.2. Molecular and Recombination Lines, and Pulsars
Carbon monoxide (CO) emits one of the most abundant molecular lines in space,
e.g. the 12CO(J = 1-0) line at 115GHz
( = 2.6mm). These data
allow one to infer the distribution of molecular hydrogen, e.g. in the
plane of our Galaxy or throughout other galaxies. A composite survey of
this line over the entire Milky Way
([Dame et
al. (1987)])
at 8.7' resolution is available as ADC/CDS catalogue #8039 and at ADIL
(Section 6.3.2).
It was made with two 1.2-m dishes, one in New York City, the other in Chile,
and provides 720 latitude-velocity maps as FITS files, one for
each 30' of Galactic longitude, and a velocity-integrated map.
The Five College Radio Astronomy Observatory (FCRAO) has mapped
336deg2
of the Galactic plane (102.5° <
< 141.5° , -3°
< b < +5.4°)
in the 12CO(1-0) line at 115GHz with 45" resolution
([Heyer et
al. (1998)]),
available at ADIL (Section 6.3.2;
imagelib.ncsa.uiuc.edu/document/97.MH.01), and at ADC.
A survey of the 12CO(2-1) line at 230GHz was made of the Galactic
plane (20° < <
60° and |b| < 1°) with 9' resolution, using
the 60-cm sub-mm telescope at Nobeyama
([Sakamoto et al. (1995)]).
It is available at ADC and CDS (#J/ApJS/100/125/).
= 2.6mm). These data
allow one to infer the distribution of molecular hydrogen, e.g. in the
plane of our Galaxy or throughout other galaxies. A composite survey of
this line over the entire Milky Way
([Dame et
al. (1987)])
at 8.7' resolution is available as ADC/CDS catalogue #8039 and at ADIL
(Section 6.3.2).
It was made with two 1.2-m dishes, one in New York City, the other in Chile,
and provides 720 latitude-velocity maps as FITS files, one for
each 30' of Galactic longitude, and a velocity-integrated map.
The Five College Radio Astronomy Observatory (FCRAO) has mapped
336deg2
of the Galactic plane (102.5° <
< 141.5° , -3°
< b < +5.4°)
in the 12CO(1-0) line at 115GHz with 45" resolution
([Heyer et
al. (1998)]),
available at ADIL (Section 6.3.2;
imagelib.ncsa.uiuc.edu/document/97.MH.01), and at ADC.
A survey of the 12CO(2-1) line at 230GHz was made of the Galactic
plane (20° < <
60° and |b| < 1°) with 9' resolution, using
the 60-cm sub-mm telescope at Nobeyama
([Sakamoto et al. (1995)]).
It is available at ADC and CDS (#J/ApJS/100/125/).
The ``Catalog of CO Observations of Galaxies'' ([Verter (1985)]) (ADC/CDS #7064) is now largely outdated. The ``FCRAO Extragalactic CO survey'' has measured 1412 positions in 300 galaxies with the 14-m dish at FCRAO (HPBW = 45", [Young et al. (1995)]) in the 12CO(1-0) line. It is apparently not available on the WWW, although its natural home appears to be the URL donald.phast.umass.edu/~fcrao/library/. The ``Swedish ESO Submillimetre Telescope'' (SEST) and the 20-m Onsala dish were used to search for CO in 168 galaxies ([Elfhag et al. (1996)]). The Nobeyama 45-m single dish has surveyed 27 nearby spirals in the 12CO(1-0) line ([Nishiyama & Nakai (1998)]).
Other comprehensive molecular line surveys and lists of transition frequencies have been published (not in electronic form) in [Sutton et al. (1985)], [Turner (1989)], and [Schilke et al. (1997)].
Radio recombination lines occur through transitions of electrons
between two energy states with very high quantum number n.
These lines are named after the atom, the destination quantum
number and the difference in n of the transition
( for
 n = 1,
 for
n = 2,
for
n = 2,
 for
n = 3, etc.).
Examples are H157
(transition from n = 158 to n = 157 in hydrogen)
or He109
(transition from n = 111 to n = 109 in helium).
They are mainly used to map departures from thermal equilibrium,
and the velocity structure in HII regions or in planetary nebulae.
To my knowledge there is no WWW site offering data on
recombination lines, but see
www.hartrao.ac.za/spectra/SP_Hii.html for an introduction
to the research done with this type of observation.
See [Lilley & Palmer (1968)] and
[Towle et
al. (1996)] for tables of radio recombination lines.
for
n = 3, etc.).
Examples are H157
(transition from n = 158 to n = 157 in hydrogen)
or He109
(transition from n = 111 to n = 109 in helium).
They are mainly used to map departures from thermal equilibrium,
and the velocity structure in HII regions or in planetary nebulae.
To my knowledge there is no WWW site offering data on
recombination lines, but see
www.hartrao.ac.za/spectra/SP_Hii.html for an introduction
to the research done with this type of observation.
See [Lilley & Palmer (1968)] and
[Towle et
al. (1996)] for tables of radio recombination lines.
A successful search for pulsars over the entire southern sky with the Parkes 64-m dish, the so-called 70-cm Pulsar Survey or ``Parkes Southern Pulsar Survey'' detected 298 pulsars, 101 of them previously unknown ([Lyne et al. (1998)]).