


Before continuing it is perhaps best to first define what is meant with the term nearby. Present day instrumentation allows angular resolutions of typically 10 arcsec or slightly better. To study the ISM in the line of HI one would like to have at least 200-300 pc linear resolution. This translates to a distance limit of about 4-6 Mpc. A quick survey of for example the nearby galaxy catalogue published by Kraan-Korteweg and Tammann (1979, see also Huchtmeier and Richter 1988), excluding from their list all dwarf irregulars and gas poor systems, and selecting only those systems which are suitably oriented shows that there are some two dozen nearby galaxy candidates. Below I will discuss the currently available results for several of these. In this discussion I will concentrate on the morphology of the HI distribution and I will make some excursions to other areas of interest such as the spin temperature, volume density and velocity dispersion of the gas.
The Magellanic Clouds are the odd ones out, and for two reasons. Firstly they are dwarf companion systems to the Galaxy with which they are in obvious interaction and as such their ISM might not be representative of a typical galaxy. Secondly, they are close enough, at a distance of about 50 kpc, that they can be meaningfully studied by a single dish telescope such as the Parkes 64-m dish. I include them in this discussion because they form a valuable step between the very detailed view which is obtained in Galactic studies and the necessarily more crude pictures which can be obtained of the nearest galaxies. Their importance will only increase once AT maps of parts of the LMC and SMC become available.
The first maps which had enough sensitivity and resolution to reveal structure in the ISM were obtained by McGee and Milton (1966), who mapped the LMC, and by Hindman (1967) who studied the SMC. Both studies were carried out with the Parkes telescope which has a resolution of 14.6 arcmin at 21-cm. They used a velocity resolution of 7.8 km s-1. The angular resolution corresponds to linear sizes of about 230 pc at the distance of the LMC. The characteristics of the HI gas in the clouds are generally similar to those of the Galaxy. The measured one-dimensional velocity dispersion is about 11 km s-1 and the average volume density of HI lies around 1 atoms cm-3. A plausible value for the spin temperature is about 200 K with some areas in the SMC, despite the large beam and consequently large area over which the ISM is averaged, showing brightness temperatures as high as 150 K.
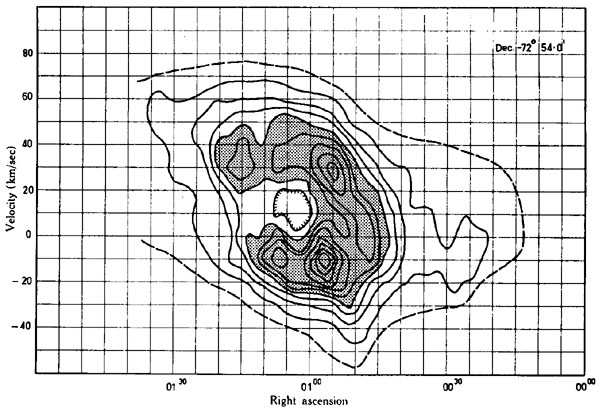
Not only were the Magellanic Clouds the first extragalactic systems in which neutral hydrogen was detected (Kerr et al. 1954), they were the first galaxies to show HI shells. Hindman, in his 1967 paper, points out thee distinct HI shells in the SMC for which he measures the position, central velocity, expansion velocity, diameter and amount of HI mass associated with the shell. Figure 1 shows an example of one of his shells. He tentatively explains their origin as due to a super-supernova explosion. To my knowledge Hindman was the first to recognize the HI shells which were found only much later in surveys of the Galaxy by Heiles (1979) as such and the first to provide their most likely interpretation. However, regarding the SMC there has arisen some controversy and it should be mentioned that several groups prefer to interpret the multiple peaked velocities in the SMC as evidence that it is being tidally disrupted (see e.g., Martin et al. (1989) and references therein).
|
Figure 1. Position velocity diagram though one of the thee SMC HI shells which were discovered by Hindman (1967). Contour levels are at 5, 10, 15... x 1.75 K brightness temperature. The shell has a diameter of 1.8 degree, corresponding to 1600 pc, and an expansion velocity of 23 km s-1. |
In the LMC, mainly due to the efforts of
Meaburn (1980)
who imaged giant and supergiant shells in the light of
H , the existence of the HI
shells and their relation with
other constituents of the ISM has been well established. Meaburn lists
nine supergiant
shells which together cover 12-15% of the surface of the LMC. Their
diameters range from
600 to 1400 pc. The largest complex, LMC4, coincides with the Shapley
Constellation III. He estimates that energies of order 10-200 ×
1051 erg are required to produce these structures.
There is no doubt that the HI holes are regions in which gas has really
been removed.
The neutral gas cannot have been entirely ionized as the predicted
H flux would exceed
the observed emission by a large factor. Also, the HI cannot have turned
into H2. In
that case one would expect a detectable 12CO signal, even
taking into account that the
metallicity of the LMC is only about one fifth of the Solar neighborhood
(see
Cohen et al. (1988)
for the first complete 12CO survey of the LMC). In addition
one would expect that the presence of molecular material would be
associated with a high value for the optical
extinction which is in contradiction with what is actually found
(Dopita et al. 1985).
, the existence of the HI
shells and their relation with
other constituents of the ISM has been well established. Meaburn lists
nine supergiant
shells which together cover 12-15% of the surface of the LMC. Their
diameters range from
600 to 1400 pc. The largest complex, LMC4, coincides with the Shapley
Constellation III. He estimates that energies of order 10-200 ×
1051 erg are required to produce these structures.
There is no doubt that the HI holes are regions in which gas has really
been removed.
The neutral gas cannot have been entirely ionized as the predicted
H flux would exceed
the observed emission by a large factor. Also, the HI cannot have turned
into H2. In
that case one would expect a detectable 12CO signal, even
taking into account that the
metallicity of the LMC is only about one fifth of the Solar neighborhood
(see
Cohen et al. (1988)
for the first complete 12CO survey of the LMC). In addition
one would expect that the presence of molecular material would be
associated with a high value for the optical
extinction which is in contradiction with what is actually found
(Dopita et al. 1985).
The parameters describing the HI shells in the Magellanic Clouds are
very similar to those of the Galaxy. The advantage of looking at the LMC
is that one can study the
relation between these shells and for example optical data and that a
direct picture of their
spatial distribution can be obtained. Such a comparison shows that the
H supergiant
shells lie along the inside of the HI shells. In turn numerous giant
H shells, powered by
young OB associations, can be found lining the inside of the supergiant
shells. The OB associations have to be younger than about 5 ×
106 year. The stars at the very center of a
supergiant shell tend to be older, about 2 × 10⁷ year.
Meaburn (1980)
suggests that this
is all evidence of star formation propagating from the center of the
shell outwards, giant
H shells
chiseling out a supergiant shell. This process continues until the HI
shell breaks out of the disk and the excess pressure is lost.
Some interesting follow-up work has been done by Dopita et al. (1985) and Meaburn et al. (1987), both groups reporting on new HI data covering either a small region of the LMC or crosscuts though a series of shells. Dopita et al. studied in detail Shapley Constellation III which coincides with LMC4. They support the idea that self propagating star formation has determined its structure. They estimate that between 32 and 100 × 1051 erg are involved. The reason why LMC4 is such a near perfect shell is attributed to the fact that Magellanic Irregulars tend to show hardly any differential rotation. Furthermore, they claim, on the basis that 15% of the surface area of the LMC is covered by HI shells and using some assumptions for the time needed to cycle the gas though the various phases of the ISM, that the LMC is in a steady state of star formation. Both Clouds have recently been reobserved using once more the Parkes telescope but with vastly improved sensitivity and velocity resolution. Rohlfs et al. (1984) remeasured the inner 6° × 6° of the LMC and Mathewson et al. (1988) reobserved three 40 arcmin diameter areas in the SMC. But because the angular resolution is the same as in the previous surveys not much more can be learned regarding the structure of the ISM. It will be up to the AT to provide the necessary increase in angular resolution.
The WSRT survey of M31 (Brinks and Shane 1984) has thrown new light on the nearest normal spiral which closely resembles the Galaxy in shape and size. The HI observations were done at a resolution of 24 × 36 arcsec which corresponds to a linear resolution of 80 × 120 pc. The effective velocity resolution was 8.2 km s-1. Although at about ten times the distance of the Magellanic Clouds, the availability of synthesis telescopes made it possible to study M31 in at least as much detail. In order to determine beam averaged values for the parameters describing the physical state of the gas, such as the spin temperature, velocity dispersion, gas volume density, etc., Brinks and Burton (1984) developed a model for the HI distribution of M31 in which they took the basic radiative transfer into account. The model calculations implied beam averaged values for M31 which are broadly consistent with values derived for the Galaxy from early single dish surveys. They found the following values for the:
 = 8 km s-1
It should be emphasized that these values are beam averages, representing the mean value over an elliptical area of 80 × 120 pc. Moreover, due to the high inclination of M31 of 77° the quoted values are averages along the line of sight as well which traverses an effective one sigma scale height of ~ 500 pc.
A new survey of the northern half of M31 by
Braun (1989)
with the VLA at a
resolution of  ×
×
 × V = 10" ×
10" × 5.1 km s-1 will eventually allow more specific
values to be determined. An interesting new result which has already
been extracted from this impressive data set and presented at this meeting
(Braun and Walterbos 1989)
is the finding that there exist clumps of HI with brightness
temperatures up to 180 K. Braun
and Walterbos argue that the peak brightness temperatures in M31
represent the upper
envelope of optically thick kinetic temperatures. This is based on the
experience in the
Galaxy where peak brightness temperatures of 135 K, which are found in
the direction of
spiral arm tangents, are interpreted as representative for the harmonic
mean of the spin
temperature, < Ts >. The value for M31 is
significantly higher than that for the Galaxy.
On the other hand, M33 shows peak brightness temperatures of only 95 K
(Deul and van der Hulst
1987).
It should be kept in mind, however, that this value is most likely a lower
limit to the intrinsic peak brightness temperature due to the relatively
large size of the
beam which was used to map M33. The value for the HI spin temperature
depends on
many processes, such as the heating due to photoelectric emission from
dust and cooling by
heavy elements. Important parameters in that respect are the
metallicity, grain depletion,
ionization rate, and gas pressure. Braun and Walterbos argue that the
complex interplay
between these factors can be parameterized in terms of the current and
past star formation rates. If this is correct, the differences in peak
brightness temperatures in the Galaxy, M31,
and M33 reflect the relative star formation rate in these galaxies.
Braun (1989)
also points out that many HI spectra show deviations from a Gaussian
profile such as steeper wings
and a flatter top which indicates that HI has an appreciable optical
depth and that at
places an amount of HI equivalent to 50% of the detected amount may be
hidden. In fact,
it is only with the present high spatial and velocity resolution that
this shows up.
× V = 10" ×
10" × 5.1 km s-1 will eventually allow more specific
values to be determined. An interesting new result which has already
been extracted from this impressive data set and presented at this meeting
(Braun and Walterbos 1989)
is the finding that there exist clumps of HI with brightness
temperatures up to 180 K. Braun
and Walterbos argue that the peak brightness temperatures in M31
represent the upper
envelope of optically thick kinetic temperatures. This is based on the
experience in the
Galaxy where peak brightness temperatures of 135 K, which are found in
the direction of
spiral arm tangents, are interpreted as representative for the harmonic
mean of the spin
temperature, < Ts >. The value for M31 is
significantly higher than that for the Galaxy.
On the other hand, M33 shows peak brightness temperatures of only 95 K
(Deul and van der Hulst
1987).
It should be kept in mind, however, that this value is most likely a lower
limit to the intrinsic peak brightness temperature due to the relatively
large size of the
beam which was used to map M33. The value for the HI spin temperature
depends on
many processes, such as the heating due to photoelectric emission from
dust and cooling by
heavy elements. Important parameters in that respect are the
metallicity, grain depletion,
ionization rate, and gas pressure. Braun and Walterbos argue that the
complex interplay
between these factors can be parameterized in terms of the current and
past star formation rates. If this is correct, the differences in peak
brightness temperatures in the Galaxy, M31,
and M33 reflect the relative star formation rate in these galaxies.
Braun (1989)
also points out that many HI spectra show deviations from a Gaussian
profile such as steeper wings
and a flatter top which indicates that HI has an appreciable optical
depth and that at
places an amount of HI equivalent to 50% of the detected amount may be
hidden. In fact,
it is only with the present high spatial and velocity resolution that
this shows up.
A different approach to probe the physical parameters of the ISM is by
HI absorption measurements. The snag here is that, compared to similar
such studies in the Galaxy, there are very few extragalactic background
sources of a sufficient strength which happen to shine
through the HI disk of nearby galaxies. Nevertheless,
Dickey and Brinks (1988),
using the VLA, made a successful attempt to detect HI absorption towards
M31. Because of the very
high resolution it was possible to eliminate from the absorption
measurements all traces of 21-cm emission. The results are summarized in
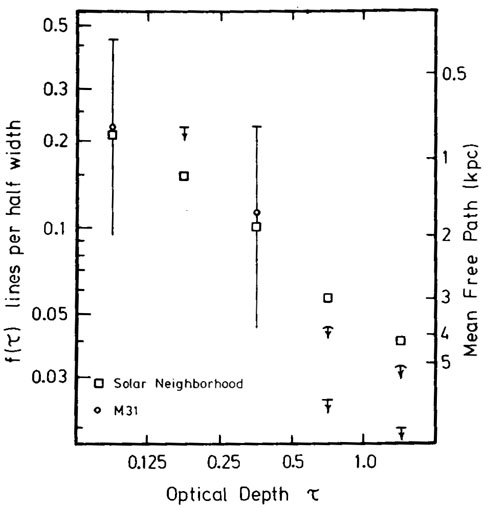
Figure 2 which compares the number
density of absorption lines per unit path length as a function of
optical depth in M31 with
similar data for the Galaxy. The observations indicate that within the
errors the absorbing
clouds in M31 are as abundant as in the Galaxy. The mean spin
temperature of the gas,
< Ts >  300 K, is similar or higher than the local value. The fraction of HI
which is in the cool (CNM) phase is about 25% or less, much higher than
predicted by the MO model,
and implies that in M31 the mixture of cool and warm phases is similar
to that in the solar
neighborhood. Moreover, as the star formation rate in M31 is much lower
than in the Galaxy, these observations prove that the mixture of phases
is not strongly dependent on
the precise values for the interstellar pressure or supernova rate and
that the WNM is a robust phase
(Cowie 1987).
300 K, is similar or higher than the local value. The fraction of HI
which is in the cool (CNM) phase is about 25% or less, much higher than
predicted by the MO model,
and implies that in M31 the mixture of cool and warm phases is similar
to that in the solar
neighborhood. Moreover, as the star formation rate in M31 is much lower
than in the Galaxy, these observations prove that the mixture of phases
is not strongly dependent on
the precise values for the interstellar pressure or supernova rate and
that the WNM is a robust phase
(Cowie 1987).
|
Figure 2. The differential number density of absorption lines in M31 compared to that measured in the Galaxy. The left hand scale indicates the probability of detecting a line per half width of the disk as a function of the optical depth of that line. The general agreement between M31 and the Galaxy suggests an identical abundance of absorbing clouds (Dickey and Brinks 1988). |
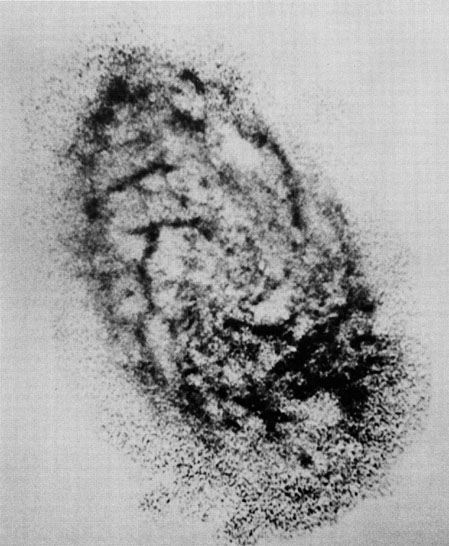
The M31 HI integrated surface brightness map which is shown in
Figure 3, as well
as the individual channel maps show a stunning amount of detail in the
form of loops, arcs and filaments.
Brinks and Bajaja (1986)
have compiled a list of 141 roughly elliptical
features which show a relative absence of neutral gas and which they
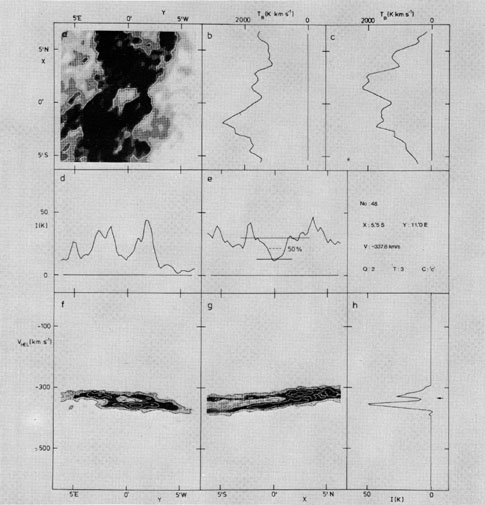
call HI holes. Figure 4 shows a blowup of one
such hole. The properties of the holes in M31 can be summarized
as follows. Their sizes range from 100 pc, the lower limit imposed by
the resolution limit of the survey to 1000 pc. Some holes show a clear
shell structure although for most holes the shell, if present, is washed
out due to the limited resolution. The majority show deviations
in the local velocity field which can be ascribed to expansion
velocities of the order of
10-30 km s-1. The amount of HI which appears to be absent as
compared to neighboring areas is 104 to 107
M . Kinematic ages
for the M31 holes range from 2.5 to 30 x 106 year.
The estimated energy requirements are 1049 to 1053
erg. Based on the observed number
of holes and some assumptions, Brinks and Bajaja estimate a Type II
supernova rate for
M31 of 10-14 pc-3 yr-1, an order of
magnitude lower than the corresponding local value
for the Galaxy. Also, if the holes trace the distribution of the HIM,
the hot gas in M31 does not form a tunneling network.
. Kinematic ages
for the M31 holes range from 2.5 to 30 x 106 year.
The estimated energy requirements are 1049 to 1053
erg. Based on the observed number
of holes and some assumptions, Brinks and Bajaja estimate a Type II
supernova rate for
M31 of 10-14 pc-3 yr-1, an order of
magnitude lower than the corresponding local value
for the Galaxy. Also, if the holes trace the distribution of the HIM,
the hot gas in M31 does not form a tunneling network.

|
Figure 3. Integrated surface brightness map of M31 at a resolution of 24 × 36 arcsec from Brinks and Shane (1984). Dark shading corresponds to HI emission. Column densities in the pronounced ring at 10 kpc correspond to about 5 × 10²¹ atoms cm-2. The rectangular X,Y-coordinate system is aligned along the principal axes and the linear scale and size of the beam are indicated. The white spot near 7.5N and 12.1W is caused by absorption against a bright far-extragalactic radio continuum source. Due to the limits of the survey the noise increases rapidly towards the northern and southern ends of the major axis. |
|
Figure 4. Collection of pictures taken from Brinks and Bajaja (1986) showing the detailed characteristics of one of the holes in M31. The panels show the following: a) expanded view of the channel map at which the hole is best seen. The contour level is drawn at 12.0 K which corresponds to the level at which the hole reaches 50% of its minimum depth; b) and c) are cross-cuts plotted on the same linear scale, made parallel to the X- and Y-axes respectively, through the total HI surface brightness map of M31; d) and e) are cuts made along the same lines and on the same scale through the channel map shown in panel a); to the right of panel e) some information is listed regarding the position of the hole within M31 and the velocity of the channel map; f) and g) are position-velocity maps made along the same cuts and on the same linear scale. The contour levels are at 10, 20, 40, and 60 K; h) shows a spectrum through the center of the hole. The arrow indicates the velocity at which the hole is best seen. |
None of the M31 holes would be classified as an HI supershell. This
could either reflect the much lower star forming activity or be related
to the fact that no high velocity
clouds have been detected thus far near M31. As is the case in the LMC
it is clear that the HI holes are regions in which the gas has been
removed. Although
H emission
is associated with many of the holes, the observed emission measure
falls far short of
what would be expected if all the gas were ionized. Following the same
argument, the HI
cannot have been all transformed into H2. The most likely
explanation is that evolving OB
associations through the combined effects of photoionization, stellar
winds and supernova
explosions shape the ISM. A comparison between the location of the HI
holes and OB
associations shows indeed that there is a correlation. Contrary to the
LMC, the disk of M31 is in differential rotation.
Palous et al. (1990)
studied the effects which shear has on
the evolution of the shells and presented a parameterization for the
evolution of their shape under the influence of shear. They predict that
matter will pile up at the tips of the hole which can lead to molecular
cloud formation and eventually star formation by the time an
HI hole closes onto itself, thus allowing for propagating star
formation. Their calculations show that the efficiency with which this
occurs depends, among other things, on the radial
distance from the center of the galaxy.
The next nearest galaxy to be discussed is M33. This system was studied
with the WSRT by
Deul and van der Hulst
(1987)
and Deul (1988).
They used a resolution of
×
×
V =
12" × 24" × 8.2 km s-1, corresponding to
spatial details of 40 × 80 pc. Figure 5
shows the integrated surface brightness map. Although M33 is smaller
than M31 it is presently much more active in forming stars.
Deul and den Hartog (1989)
made an analysis similar to the one discussed above for M31 and came up
with the following results. M33 contains some
148 HI holes larger than 40 pc, the resolution limit. Their diameters
range from 40 pc to
1000 pc, the larger holes lying preferentially at larger galactocentric
distances. The swept up mass ranges from 103 to
105 M
and their kinematic ages peak around 5 × 10⁶ year.
The estimated energies cover the same range as the holes in M31, none of
them clearly belonging to the class of supershells. The distribution of
the HI holes in M33 is shown
in Figure 6 which can be directly compared with
Figure 5, the HI map. Deul and den
Hartog confirm the correlation of HI holes with OB associations and
suggest that smaller HI holes tend to coincide with single HII regions
and OB associations whereas the larger, and presumably older holes tend
to show star formation along their periphery. This would
be in agreement with the description given by
Meaburn (1980) and
Dopita et al. (1985)
for the holes and supergiant
H shells in the LMC,
although in the case of M33 one should
also take into account the effects which differential rotation has on
the shape of the holes as explained by
Palous et al. (1990).
The three giant HII regions, NGC595, NGC604 and
IC133 all coincide with well-contrasted holes of
similar morphology.
|
Figure 5. Radio photograph of the HI column density distribution in M33 at full resolution. The column densities range from 1.5 × 10²⁰ to 5.5 × 10²¹ atoms cm-2. Note the enormous amount of detail and the many loops, arcs and filaments. (Photo courtesy of E. Deul). |

|
Figure 6. Spatial distribution of the HI holes in M33 as outlined by Deul and den Hartog (1989). The scale for this picture is the same as for the integrated surface brightness map shown in Figure 5. Note the concentration of small holes in the inner galaxy. The larger holes are generally interarm cavities. |
Deul and den Hartog searched for 12CO emission at the location of four holes to test the hypothesis that neutral gas is transformed into molecules. Their upper limits confirm that there is less material at the locations they sampled, unless the conversion factor between the measured 12CO surface brightness and H2 column density is smaller than 0.3 times the Galactic conversion factor. More sensitive 12CO observations and at a higher spatial resolution would settle this question once and for all. In brief, the results on M33 generally agree very well with what has been found in M31, the LMC and the Galaxy.
IC10 is a Local Group galaxy at a distance of 1.3 Mpc which has been mapped in HI by Shostak and Skillman (1989, and references therein). Its HI distribution is quite unusual and the authors propose that the outer HI envelope is still in a collapse phase. In the inner disk seven prominent holes are visible (see Figure 7). Due to the patchy nature the holes are somewhat less easily defined than, for example, those in M31 or M33. The derived linear sizes range from 200 to 800 pc. The estimated energies which are required to produce them are 2-300 × 1051 erg, agreeing quite well with what we know about similar features in other galaxies. Interestingly, in addition to the HI holes, Skillman finds an area measuring about 230 pc in diameter which stands out in non-thermal radiation and which coincides with the most massive HI concentration. He interprets this region as a superbubble in an early stage of its evolution and predicts that eventually this bubble might evolve to a supergiant shell with a diameter of the order of 1000 pc.
|
Figure 7. A close-up of the inner HI disk of the local irregular galaxy IC10, identifying the positions of the HI holes (taken from Shostak and Skillman 1989). The peak column density is 4.1 × 10²¹ atoms cm-2 and the contour levels are placed at 10% intervals of the peak value. |
Another galaxy worth mentioning is IC1613 which was imaged in
H by
Meaburn et al. (1988)
and in HI by
Lake and Skillman (1989).
As in, for example, the LMC
a multitude of H filaments
is visible which link up to form giant and supergiant
H
shells. The HI maps, although made at a moderate resolution, show
several HI holes. It would be interesting to reobserve this galaxy at a
higher resolution and to compare the HI morphology with the
H structures.
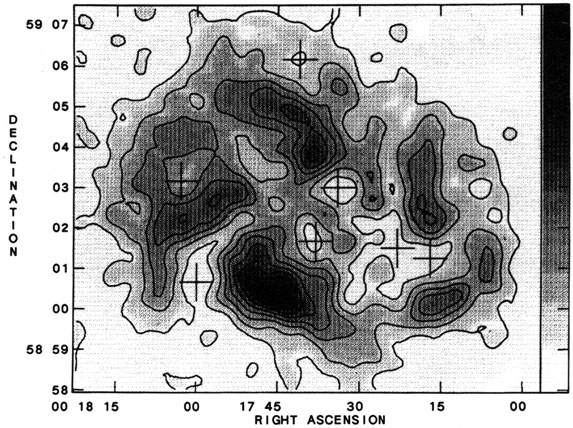
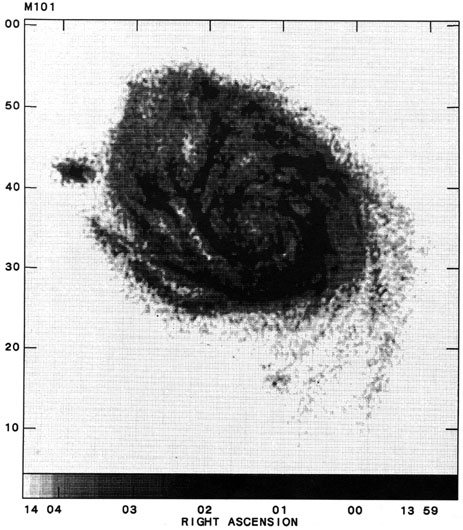
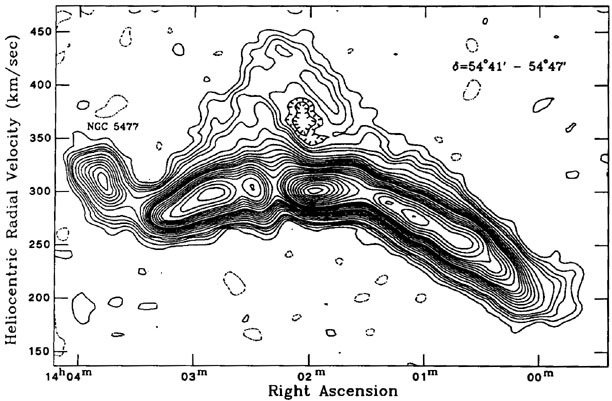
Until now I have mainly dealt with those features in the ISM of nearby galaxies which can be understood in terms of the evolution of a group of massive stars and their influence on their environment. But, at several instances it was pointed out that some of the structures might in fact be too large or require too much energy to be explained this way. Van der Hulst and Sancisi (1988) recently reobserved M101 with the WSRT (see Figure 8). They noticed in their HI maps two regions in which the HI is displaced to very high velocities with respect to the normal disk rotation. An example is shown in Figure 9. Simple energy considerations would imply kinetic energies of over 1054 erg. There are no obvious signs of young stars which could be held responsible for creating these giant structures. Similar features, though with lower energies, have been found by Kamphuis et al. (1990) in another system, NGC6946, but in this case it is not yet quite clear if a supernova origin is ruled out by the data.
|
Figure 8. Total HI surface brightness map of M101. At the assumed distance of 7.2 Mpc, 1 arcmin corresponds to 2 kpc. The most prominent area where deviating HI gas is found is located at 14h02m and 54°44'. (Image courtesy of J. Kamphuis). |
The explanation which van der Hulst and Sancisi propose for their
observations of M101 is the infall of high velocity clouds. Support for
this interpretation can be found in the Galaxy. As argued by
Tenorio-Tagle and
Bodenheimer (1988)
it is very difficult to account for the supershells found by
Heiles (1979)
by multiple supernova explosions.
The reason is that once a shell grows large enough to break through the
disk, all the
energy from subsequent supernova events will be channeled to the
halo. On the other hand, infall of a cloud with a velocity of 100 km
s-1 and a mass of 105
M corresponds
to the deposition of some 1052 erg in the disk of a
galaxy. As shown by
Tenorio-Tagle et
al. (1987)
the conversion efficiency is in the region of 15-25%, much higher than the
few percent of the total energy output of an OB association which is
converted to kinetic
energy. In other words, HVC infall can be an efficient mechanism to
create large scale
remnants. Another point of interest is that the infall model explains
why many of the shells show one hemisphere only, as was noticed by
Heiles (1979).
Tenorio-Tagle et al. show that extrapolation of such a partial shell to
a complete bubble overestimates their energy tremendously.
|
Figure 9. Position-velocity diagram averaging the emission in a declination strip some 7 arcmin wide and centered on the hole mentioned in Fig. 8. Local minima are indicated by tick marks. Contours levels are -2, 2, 4..., 10, 15, ..., 50, 60, ..., 100, 120, ..., 280 K. Figure taken from van der Hulst and Sancisi (1988). |
From the large scale surveys of Hulsbosch and Wakker (1988) and Bajaja et al. (1985) it is clear that the sky is filled with HVCs. Looking at those clouds which have the highest velocities (VHVCs), Mirabel and Morras (1984) and Mirabel (1989) claim that they represent high velocity inflow of material toward the Galaxy. This does not settle the question if the VHVCs are infalling intergalactic matter or tidal debris from the Magellanic Stream, or if the material is indirectly connected to star formation. It could be hot matter which was expelled from the disk after an HI shell has broken through and which is condensing out and raining down on the disk, as described in galactic fountain and chimney models (Bregman 1980, Corbelli and Salpeter 1988, Norman and Ikeuchi 1989). Additional observations might eventually provide an answer.
In order to study the HI distribution of galaxies one usually chooses systems which are relatively face-on. However, to obtain information on the z-distribution one has to turn to edge-on galaxies. Rupen (1991) has successfully resolved the HI layer in two edge-on systems, NGC 4565 and NGC 891. His VLA data extend the work on the thee-dimensional structure of disks in spiral galaxies which was recently reviewed by van der Kruit (1988). Figure 10 shows a set of channel maps of NGC 891. Both galaxies show a flaring of the HI layer when moving to larger distances from the center. Rupen finds for NGC 4565 values for the one sigma scale height, h(r), ranging from 120 pc for the inner disk to about 300 pc at around 16 kpc at which radius the warp sets in. Corresponding values for NGC 891 are 105 pc for the center and 235 pc at the last measured point near 11 kpc. The values at small radii agree comfortably with those quoted for the inner disks of the Galaxy and M31. These observations also confirm that the HI layers at large galactocentric distances flare. For the Galaxy this was discussed by Kulkarni et al. (1982). In the case of M31 this could only be inferred on the basis of the model fits (Brinks and Burton 1984).

|
Figure 10. Series of HI channel maps at 20 arcsec resolution of NGC 891. The maps have been rotated to put the major axis horizontal, north pointing to the left. Each panel shows the two channel maps which are symmetrically placed with respect to the systemic velocity (530 km s-1). The heliocentric velocities are indicated on top. Contour levels are plotted at -10, -8, ..., -2, 2, 4, ..., 10, 15, ..., 45 mJy beam-1. The bottom right hand panel shows a map of the integrated HI distribution with contour levels at 0.1, 0.2, 0.5, 1.0, ..., 4.0 Jy beam-1 km s-1. (Map courtesy of M. Rupen). |
The scale height of the gas layer is inversely proportional to the mass
volume density,
 (r, z), in
the disk at z = 0, and can be written as h(r) =
g /
[4
(r, z), in
the disk at z = 0, and can be written as h(r) =
g /
[4 G
(r,
0)]1/2 where G is the gravitational constant (see e.g.,
Kulkarni et al. 1982).
From studies of face-on galaxies it has
been shown that g
is constant and ranges from 7-10 km s-1
(van der Kruit and Shostak
1984).
Hanson et al. (1990)
observed with improved sensitivity and velocity resolution
the nearby face-on galaxy NGC 1058. They confirm that
g is constant
over most of the disk at a value of 5.7 km s-1, slightly
lower than the value previously quoted by van der
Krit and Shostak. Assuming a constant velocity dispersion, Rupen's
observations of the edge-on systems yield a direct measurement of the
mass volume density and, if the mass
distribution follows the old star light, the M/L value as a
function of radius. The data on
both galaxies are consistent with a constant M/L
3 M /
L. Although it is
tempting to assume that all galaxies feature a flaring HI disk and that
the velocity dispersion of the gas
perpendicular to the disk is constant, one has to be cautious.
Bottema et al. (1986)
found at least one (dwarf) galaxy, NGC 5023, in which the scale height
of the HI gas appears constant.
G
(r,
0)]1/2 where G is the gravitational constant (see e.g.,
Kulkarni et al. 1982).
From studies of face-on galaxies it has
been shown that g
is constant and ranges from 7-10 km s-1
(van der Kruit and Shostak
1984).
Hanson et al. (1990)
observed with improved sensitivity and velocity resolution
the nearby face-on galaxy NGC 1058. They confirm that
g is constant
over most of the disk at a value of 5.7 km s-1, slightly
lower than the value previously quoted by van der
Krit and Shostak. Assuming a constant velocity dispersion, Rupen's
observations of the edge-on systems yield a direct measurement of the
mass volume density and, if the mass
distribution follows the old star light, the M/L value as a
function of radius. The data on
both galaxies are consistent with a constant M/L
3 M /
L. Although it is
tempting to assume that all galaxies feature a flaring HI disk and that
the velocity dispersion of the gas
perpendicular to the disk is constant, one has to be cautious.
Bottema et al. (1986)
found at least one (dwarf) galaxy, NGC 5023, in which the scale height
of the HI gas appears constant.
Interestingly the maps of NGC 891 show numerous wiggles which Rupen ascribes
to non-thermal processes. It would be interesting to see to what extent
these wiggles are associated with the features which are seen in
H and which were presented
at this meeting by
Dettmar et al. (1990) and
Kulkarni et al. (1990).
Both groups indicate that there are
filaments in their H maps
which originate in star forming regions in the disk and which
stick out of the plane. Are we seeing here evidence for the disk-halo
interaction as proposed by the galactic fountain and chimney models?
The last galaxy which I would like to mention is the edge-on spiral NGC 3079 which was observed with the VLA in HI by Irwin and Seaquist (1990). This galaxy not only displays remarkable activity in the center but it also contains half a dozen HI shells in its disk. Their dimensions and energy requirements as derived by Irwin and Seaquist place them in the category of Heiles supershells. Again, if these features are caused by the collective effects of several star forming regions, it is tempting to interpret these observations in terms of chimney models in which hot material from a bubbling disk flows into the halo.