


To put the results of the COBE CIB measurements in a broader
perspective,
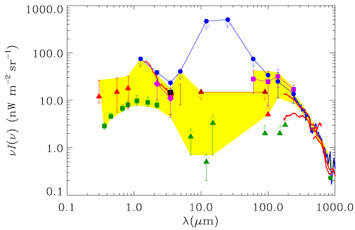
Figure 2 shows the extragalactic background
light from the UV to submillimeter wavelengths. All of the measurements
are shown with 2 error
bars. Measurements based upon COBE data are as shown in
Figure 1 (see
Table 1 for references). The recently
reported CIB measurement from the IRTS mission
(Matsumoto et
al. 2000)
is shown as a curve from 1.4-4.0 µm. The detections at
UV-optical wavelengths are from the recent report by
Bernstein (1999)
(
error
bars. Measurements based upon COBE data are as shown in
Figure 1 (see
Table 1 for references). The recently
reported CIB measurement from the IRTS mission
(Matsumoto et
al. 2000)
is shown as a curve from 1.4-4.0 µm. The detections at
UV-optical wavelengths are from the recent report by
Bernstein (1999)
( I = 12, 15, and
18 nW m-2 sr-1 at 0.3, 0.55 and 0.8 µm
respectively). The lower limits to the background light from UV to 2.2
µm are obtained from integrated galaxy counts obtained from
the ground and the Hubble Space Telescope (summarized by
Madau & Pozzetti
2000).
Lower limits in the mid and far infrared are based upon galaxy counts
with the ISOCAM (7-15 µm) and ISOPHOT (90-175
µm) instruments on the ISO mission
(Altieri et al. 1999,
7 and 15 µm;
Clements et
al. 1999,
12 µm;
Juvela, Mattila,
& Lemke 2000,
90 and 150 µm;
Puget et al. 1999,
175 µm).
The lower limit at 850 µm is based on the integrated light
from source counts with the SCUBA instrument
(Blain et al. 1999).
The shaded region in Figure 2 indicates
2 upper and lower limits on
the brightness of the extragalactic background light based upon all of
these data.
I = 12, 15, and
18 nW m-2 sr-1 at 0.3, 0.55 and 0.8 µm
respectively). The lower limits to the background light from UV to 2.2
µm are obtained from integrated galaxy counts obtained from
the ground and the Hubble Space Telescope (summarized by
Madau & Pozzetti
2000).
Lower limits in the mid and far infrared are based upon galaxy counts
with the ISOCAM (7-15 µm) and ISOPHOT (90-175
µm) instruments on the ISO mission
(Altieri et al. 1999,
7 and 15 µm;
Clements et
al. 1999,
12 µm;
Juvela, Mattila,
& Lemke 2000,
90 and 150 µm;
Puget et al. 1999,
175 µm).
The lower limit at 850 µm is based on the integrated light
from source counts with the SCUBA instrument
(Blain et al. 1999).
The shaded region in Figure 2 indicates
2 upper and lower limits on
the brightness of the extragalactic background light based upon all of
these data.
|
Figure 2. Measurements of the extragalactic background light. See text for references. |
Figure 2 shows that the resolved component of
the extragalactic light is beginning to approach the detected background
at the shortest and longest wavelengths in this range. This reflects a
dramatic change in observational knowledge over the past few years. It
is reassuring that the resolved component has not exceeded the claimed
CIB detections or upper limits at any wavelength. The CIB at

 140 µm and in the
near infrared at 2.2 and 3.5 µm is relatively
well-determined by the direct sky brightness analyses. However,
systematic uncertainties in the foregrounds are substantial, with none
of the CIB detections being positive by more than several times the
systematic uncertainties. Isotropy tests, if done at all, are generally
over very limited sky areas. It would therefore seem premature to
consider the differences between detections and lower limits as clear
evidence for missing components of the background. In terms of energy
distribution, the
I values in the
shortest and longest wavelength regions are rather comparable.
140 µm and in the
near infrared at 2.2 and 3.5 µm is relatively
well-determined by the direct sky brightness analyses. However,
systematic uncertainties in the foregrounds are substantial, with none
of the CIB detections being positive by more than several times the
systematic uncertainties. Isotropy tests, if done at all, are generally
over very limited sky areas. It would therefore seem premature to
consider the differences between detections and lower limits as clear
evidence for missing components of the background. In terms of energy
distribution, the
I values in the
shortest and longest wavelength regions are rather comparable.
In the range from 4.9 to 100 µm the picture is less
certain. Limits from the direct brightness analyses are relatively high,
and quite possibly strongly contaminated by residual emission from the
interplanetary dust. The upper limits from fluctuation analyses
suggested by
Kashlinsky et
al. (1996b) and
Kashlinsky &
Odenwald (2000)
in this range are certainly the most restrictive, though dependent upon
their estimate of the relationship between fluctuations and total
light. Other fairly restrictive upper limits in this spectral range come
from analysis of attenuation of TeV
 -rays, as reviewed
elsewhere at this conference
(Stecker 2001).
-rays, as reviewed
elsewhere at this conference
(Stecker 2001).
Taking the most restrictive limits at face value, the emerging picture
is one of substantial background energy in the far infrared and
submillimeter, with a comparable level in the near infrared. To make
this picture somewhat quantitative, one can integrate the background
intensity in the near infrared (1.25-3.5 µm), thermal
infrared (3.5-100 µm), and submillimeter (100-2000
µm) ranges. One finds integrated intensities of ~ 20, <
56, and ~ 16 nW m-2 sr-1 respectively. Using the
measurements reported by
Bernstein (1999),
the UV-optical background (0.3-1.25 µm) contains ~ 25
nW m-2 sr-1 of additional background energy. Thus,
0.4 IFIR /
IUV - OPT 1.6, where
IFIR is the integrated long-wavelength background (3.5-2000
µm) and IUV - OPT is the integrated
short-wavelength background (0.3-3.5 µm). The
long-wavelength and short-wavelength backgrounds contain comparable
total energy.
Assuming that the short-wavelength energy comes primarily from
redshifted starlight and that the long wavelength radiation comes from
starlight absorbed and reradiated by dust, the large far-infrared
background implies that a substantial amount of cosmic star formation
has been enshrouded in dust, a conclusion reached by many investigators
as soon as evidence for the CIB emerged (e.g.,
Puget et al. 1996;
Schlegel et
al. 1998;
Hauser et al. 1998).
That interpretation has been reinforced by the deep galaxy counts at far
infrared wavelengths with the ISO and SCUBA instruments. The total
background energy in the spectral range 0.3-2000 µm,
IEBL, is given by IEBL
 60-120
nW m-2 sr-1, or, in terms of the critical density,
60-120
nW m-2 sr-1, or, in terms of the critical density,

|
where h = H0 / (100 km sec-1
Mpc-1) and H0 is the Hubble constant. For
comparison, the integrated EBL contains only about 10% of the integrated
energy in the cosmic microwave background,
 CMB = 2.5 ×
10-5 h-2.
CMB = 2.5 ×
10-5 h-2.
With the assumption that the integrated extragalactic background energy
primarily arises from nucleosynthesis in stars, one can estimate the
mass density consumed in the production of helium and heavier elements,
 Z, from
the relation
(Peebles 1993):
Z, from
the relation
(Peebles 1993):
|
Expressing
Z as a
fraction of the critical mass density,
c, this
yields
|
where we have assumed that most of the energy release occurs at redshift
ze
1. Since Big Bang nucleosynthesis arguments give a cosmic baryon mass
density
(Kolb & Turner
1990;
Steigman et
al. 1999)

|
this simple argument suggests that the current estimate of the integrated extragalactic background light implies conversion of 1-8% of the cosmic hydrogen into helium and heavier elements by stars.
The present knowledge of the CIB provides significant constraints on models of star formation and galactic evolution (e.g., Dwek et al. 1998; Pei, Fall, & Hauser 1999). These topics are addressed by others at this conference.