


3.1. X-Ray Observations of Superwinds
The overall X-ray properties of starburst galaxies have been recently reviewed by Petre (1993), so we will focus on the interplay between the X-ray data and the superwind phenomenon. X-ray observations of superwinds are crucial to our understanding of the phenomenon, because (potentially at least) they offer the most direct probe of the hot, tenuous superwind fluid itself (rather than simply probing the interaction of the wind with ambient gas, as is most likely the case for the optical line emission).
The characteristic temperature corresponding to the complete thermalization
of the kinetic energy from an ensemble of supernovae and winds
from massive stars is about kT = 10 keV (e.g., 1051
ergs per
10 M )
- see Section 2 above. Thus we expect hard
X-ray emission from a galaxy driving
a superwind to come from the hot and tenuous supernova/wind-heated gas
inside the starburst (i.e., inside the sonic radius of the wind). Since the
corresponding terminal velocity of the outflowing superwind fluid is several
thousand km s-1, hard X-rays will also arise from internal
shocks in the superwind (cf.
Tomisaka & Ikeuchi 1988;
Balsara, Suchkov, &
Heckman 1993).
In the idealized expanding bubble discussed in
Section 2 above, these
X-rays will be coming from zone 3.
)
- see Section 2 above. Thus we expect hard
X-ray emission from a galaxy driving
a superwind to come from the hot and tenuous supernova/wind-heated gas
inside the starburst (i.e., inside the sonic radius of the wind). Since the
corresponding terminal velocity of the outflowing superwind fluid is several
thousand km s-1, hard X-rays will also arise from internal
shocks in the superwind (cf.
Tomisaka & Ikeuchi 1988;
Balsara, Suchkov, &
Heckman 1993).
In the idealized expanding bubble discussed in
Section 2 above, these
X-rays will be coming from zone 3.
Soft X-rays will be produced by dense ambient material that is shock-heated and/or evaporated by the superwind (cf. Watson, Stanger, & Griffiths 1984; White & Long 1991). In the idealized 'expanding bubble' model discussed in Section 2, this would correspond to the thin shell of shocked ambient gas at the interface with the undisturbed ambient gas (zone 4). In a more realistic situation, the soft X-rays will arise as the wind collides with, shock-heats, and evaporates density inhomogeneities ('clouds') in the galaxy halo. H I observations of starbursts show that such cool, dense material indeed exists in the environs of starbursts (see Section 3.4 below). Note that the typical outflow velocity of dense, wind-accelerated ambient material is observed in the optical to be several hundred km s-1 (see Section 3.2 below), corresponding to post-shock temperatures of kT ~ 200 eV.
This theoretical/phenomenological picture is in reasonable agreement with the limited amount of X-ray data presently available for starburst galaxies. The X-ray luminosity of starburst galaxies correlates rather well with both the IR luminosity (e.g., Griffiths & Padovani 1990; David, Jones, & Forman 1992; Green, Anderson, & Ward 1992) and the Lyman continuum luminosity (Ward 1988) of the starburst. Moreover, the observed average ratio of X-ray and bolometric starburst luminosities agrees roughly with the predictions of simple theoretical models for starburst-driven superwinds (HAM - and see the discussion in Section 2 above). X-ray spectra of starbursts imply characteristic temperatures of kT = 6 to 9 keV for the global X-ray emission (e.g., Kim, Fabbiano, & Trinchieri 1992; Ohashi et al. 1990; Petre 1993), again in agreement with simple models (see Section 2 above).
Spatially-resolved X-ray images of well-studied starburst galaxies whose large-scale stellar disks are viewed nearly edge-on (M 82, NGC 253, NGC 2146, and NGC 3628) show striking X-ray 'halos' or 'plumes' that can extend out to a radius of 10 kpc or more along the galaxy minor axis. These have been interpreted as direct evidence for galactic superwinds (e.g., Watson, Stanger, & Griffiths 1984; Fabbiano 1988; Fabbiano, Heckman, & Keel 1990; Heckman & Fabbiano 1993; Armus, Heckman, & Weaver 1993). The transgalactic-scale X-ray nebulae associated with such 'ultraluminous' IR galaxies as Arp 220, NGC 3690, and Mrk 266 are likely to be more energetic versions of this phenomenon (Eales & Arnaud 1988; Armus, Heckman, & Weaver 1993).
In general, the estimated thermal energy content and mass of the X-ray gas are consistent with the time-integrated kinetic energy and mass output of the starburst (cf. HAM and references therein). However, these estimates are based on several simplifying assumptions. The most important of these are that all the observed X-rays arise from hot gas at a uniform - and high - temperature equal to that deduced on the basis of the integrated X-ray spectrum, and that this gas has a volume filling factor of unity. As we now discuss, the actual situation is likely to be considerably more complex.
The X-ray emission from the halo of M 82 is significantly softer than
that from the central starburst
(Petre 1993),
as is also the case in NGC 3628
(Fabbiano, Heckman, & Keel
1990;
Heckman & Fabbiano 1993)
and NGC 3690
(Armus, Heckman, & Weaver
1993).
Within the context of the
superwind model, this could imply that the wind has broken free of the
galaxy and has suffered severe adiabatic cooling on its way out (cf. CC
and Equation 6 above). However, this is unlikely to be the case, since the
X-ray nebulae are far too bright to simply be an adiabatically-cooled
free-wind (e.g.,
Mathews & Doane 1993).
Our new ROSAT images of several
starbursts with superwinds also show a considerable amount of fine-scale
structure: X-ray-bright 'lumps' and 'filaments' with sizes of a few hundred
pc to a few kpc
(Heckman & Fabbiano 1993;
Armus, Heckman, & Weaver
1993).
We believe it is most likely that the soft (kT
One of the most interesting X-ray observations of a likely superwind is
the Ginga data on the center of our own Milky Way
(Yamauchi et al. 1990).
Emission-line images using the 6.7 keV Fe K line imply a region of gas
with a
temperature of about 108 K, dimensions of about 270 ×
150 pc, gas pressures
of P/k = 8 × 10⁶ K cm-3, and total
thermal energy content of 6times1053
ergs. Since the sound speed in this gas (~ 1500 km s-1) greatly
exceeds the
escape velocity from the Galactic Center, the gas should flow out as a high
speed wind (unless it is confined by some other mechanism). If this outflow
is a steady-state phenomenon, collisional heating with a supernova rate of
about 0.6 per century within this volume is required to balance adiabatic
cooling.
To summarize, while the current situation regarding X-ray emission from
superwinds is unclear, we can expect dramatic progress over the next few
years as the avalanche of new ROSAT, BBXRT, and ASTRO-D data on
starbursts is analyzed and digested. Certainly the data already in hand are
very tantalizing.
3.2. Optical Line Emission from Superwinds
Most of the existing data on superwinds concern the optical line emission
associated with such outflows. Such data provide a whole array of
diagnostics of the dynamical and physical state of the outflow.
In the simple schematic pictures described in
Section 2 above, the optical line
emission would not arise from the very hot and tenuous superwind fluid
itself (the cooling times are excessively long, and most of the relatively
feeble
radiation that is produced there is in the form of hard X-rays). Instead, we
would expect the optical line emission to come from relatively dense ambient
material into which the wind's ram pressure drives slow (< few hundred km
s-1) radiative shocks (e.g.,
McKee & Hollenbach 1980
and see Section 2.2 above).
In the wind-blown bubble 'onion-skin' model, this material would be the
thin, dense shell of compressed and shock-heated ambient gas at the leading
edge of the bubble. In a more realistic situation in which blow-out has
occurred, and/or in which the wind is propagating through a inhomogeneous,
multi-phase medium, the optical line emission will come from clouds (e.g.,
fragments of the ruptured shell, pre-existing density inhomogeneities in the
halo, or material carried out of the galactic disk by the superwind).
We therefore expect that the optical data will provide a detailed - but
indirect - view of the superwind phenomenon. The largest compilations of
such data are found in the recent spectroscopic and narrow-band imaging
surveys by
HAM, Armus, Heckman, & Miley
(1989,
1990
- hereafter AHM89, AHM9O),
Lehnert (1992
- hereafter L92), and Lehnert & Heckman
(1993
- hereafter LH).
3.2.1. Structure and Luminosity
Galaxies selected to be both luminous and warm in the far-IR have optical
emission-line nebulae whose size and luminosity correlate reasonably well
with the far-IR luminosity, and hence with the estimated formation rate
of massive stars (AHM9O; L92; LH). The
H
We (L92, LH) have recently completed an
H
Figure 2.
H
Figure 3.
H
HAM, L92, and LH have measured radial electron density profiles in the
emission-line nebulae associated with about 20 IR-selected starburst
galaxies. Densities range from 103 to < 102
cm-3. The
observed H
In the few starburst galaxies for which both
H
Figure 4. Overlaid
H
3.2.2. Kinematics and Dynamics
The kinematics of the optical emission-line gas associated with IR-luminous
galaxies also suggest that outflows are common. Optical spectra of the
nuclei of IR-luminous galaxies show that they often have blue-asymmetric
emission-line profiles (e.g., AHM89; LH;
Phillips 1992).
Mirabel & Sanders (1988)
find that the optical emission-line velocities in the nuclei of
high-luminosity IR galaxies are blueshifted with respect to the galaxy
systemic
velocity by an average of about 100 km s-1. Both the
blue-asymmetric
profiles and blueshifts suggest an outflow of ionized gas whose redshifted
back side is obscured by dust.
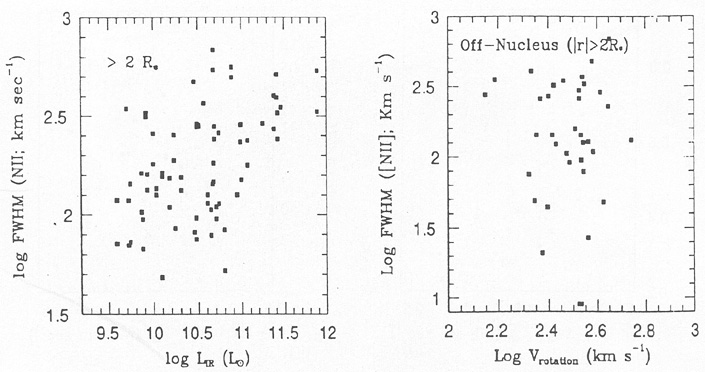
For the edge-on starburst galaxies investigated by L92 and LH, in many
cases the line widths actually increase with increasing radius along the
minor
axis. The emission-lines are also systematically broader along the minor
than
along the major axis (with typical FWHM's of 150 to 350 km
s-1 vs. × 100
to 200 km s-1 respectively). The line widths along the minor
axis correlate
strongly with the starburst IR luminosity, but not with the galaxy rotation
speed, thus favoring a starburst-driven outflow over simple orbital motions
in the galaxy gravitational potential (see
Figure 5). This interpretation is
further supported by the strong trend found by L92 and LH for the largest
measured velocity shears along the minor axis to occur in the galaxies
viewed
more nearly face-on (as expected for a starburst-driven radial outflow along
the minor axis) and in the galaxies with the highest IR luminosities (see
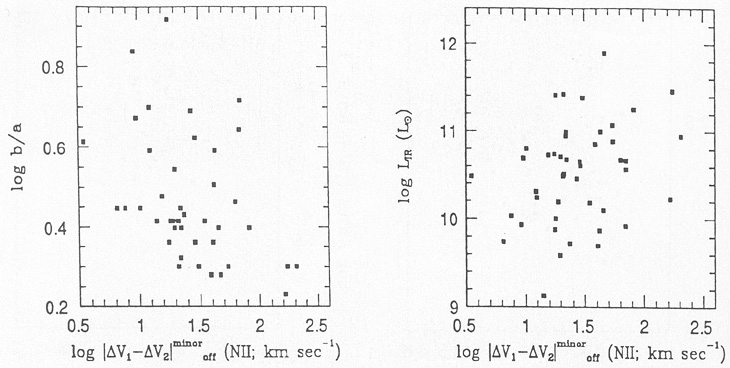
Figure 6).
Figure 5. Summary of the kinematics of the
emission-line gas located outside the
central starburst and along the optical minor axis for the IR-selected
edge-on disk
galaxies investigated by L92 and LH. The x-axis in both plots is the
FWHM of the [N II]6584 line. This line width correlates strongly with
the IR luminosity
of the galaxy (left plot), but not with the rotation speed of the
galaxy (right plot), implying that the gas dynamics is influenced much
more strongly by the starburst-driven wind than by gravity.
Figure 6. Summary of the kinematics of the
emission-line gas located along the optical
minor axis for the IR-selected edge-on disk galaxies investigated by
L92 and LH.
These two plots show that the velocity shear along the minor axis is
largest in the
galaxies that are viewed more nearly face-on (left plot) and in the
galaxies with the largest IR luminosities (right plot).
The detailed kinematic properties of the gas located along the minor axes
of such nearby and well-studied edge-on starbursts as M 82 (e.g.,
Bland & Tully 1988;
HAM), NGC 253
(Ulrich 1978;
HAM), NGC 3079 (HAM;
Filippenko & Sargent
1992),
and NGC 4945 (HAM) provide more direct evidence
for outflows. All four galaxies have bubble-like or filamentary
emission-line
nebulae that protrude out about a kpc along the optical minor axis. The
kinematics of these structures (broad, double-peaked emission-line profiles
in the center of the bubble, narrowing to single-peaked profiles along the
bubble periphery) imply that they are either expanding bubbles or the walls
of cone-like or cylindrical outflows, with inferred outflow/expansion speeds
ranging from about 200 km s-1 to nearly 1000 km
s-1 (see Figure 7). The
sizes and expansion speeds of these structures are in good agreement
with the
quantitative predictions of the simple wind-blown-bubble model discussed in
Section 2 (see equations 9 and 10 above, and
HAM). Additional examples of similar
outflow structures are found in the composite Seyfert/starburst galaxies
NGC 1365
(Phillips et al. 1983a),
NGC 5506
(Wilson, Baldwin, &
Ulvestad 1985),
NGC 7582
(Morris et al. 1985),
and Mrk 509
(Phillips et al. 1983b).
Figure 7. Long-slit spectrum of (from left
to right) the
[N II]
Qualitatively similar, but even larger and more energetic examples of
such expanding structures, are found in several 'ultraluminous' IR galaxies
(HAM). These are the 'double-bubble' emission-line nebula in Arp 220, the
central 'hour-glass' structure in NGC 6240, and the extraordinary nebula
associated with IRAS 00182-7112 in which line-widths are nearly 1000 km
s-1
over a region 30 kpc in extent.
Colina, Lipari, &
Macchetto (1991)
have also published kinematic evidence for a superwind in the ultraluminous
galaxy IRAS 19254-7245.
On the 'micro-starburst' level,
Meurer et al. (1992)
have found a
kpc-scale bubble of ionized gas expanding at about 50 km s-1
in the core of the
post-starburst dwarf galaxy NGC 1705. They show that this expansion was
probably powered by the kinetic energy supplied by a burst of star-formation
that occurred some 10 Myr ago.
Roy et al (1991)
have found a kinematically
similar 200 pc-scale expanding bubble of ionized gas in the starbursting
dwarf irregular galaxy  luminosities of the
extra-nuclear portion of the nebulae (e.g., well outside the starburst
region) are
just consistent with the predictions of the superwind model (see Equation
11 and the associated discussion in
Section 2 and in HAM).
imaging survey of a sample
of edge-on disk galaxies selected on the basis of far-IR flux and color, and
find many examples which show emission-line filaments, loops, or bubbles
extending out one to ten kpc along the optical minor axis of the galaxy
(four examples are shown in Figure 2). In
general, we find a pronounced
excess of optical line emission along the optical minor axis compared to
what
would be expected for ordinary emission-line gas confined to the galactic
disk. At the highest levels of IR luminosity (L > few ×
1011
L), the
H
nebulae approach transgalactic dimensions (30-100 kpc), with the
large-scale morphology often dominated by filaments, loops, or bubbles
(e.g.,
Heckman, Armus, & Miley
1987;
AHM90).
Some examples of such nebulae are shown in Figure 3.
luminosities of the
extra-nuclear portion of the nebulae (e.g., well outside the starburst
region) are
just consistent with the predictions of the superwind model (see Equation
11 and the associated discussion in
Section 2 and in HAM).
imaging survey of a sample
of edge-on disk galaxies selected on the basis of far-IR flux and color, and
find many examples which show emission-line filaments, loops, or bubbles
extending out one to ten kpc along the optical minor axis of the galaxy
(four examples are shown in Figure 2). In
general, we find a pronounced
excess of optical line emission along the optical minor axis compared to
what
would be expected for ordinary emission-line gas confined to the galactic
disk. At the highest levels of IR luminosity (L > few ×
1011
L), the
H
nebulae approach transgalactic dimensions (30-100 kpc), with the
large-scale morphology often dominated by filaments, loops, or bubbles
(e.g.,
Heckman, Armus, & Miley
1987;
AHM90).
Some examples of such nebulae are shown in Figure 3.
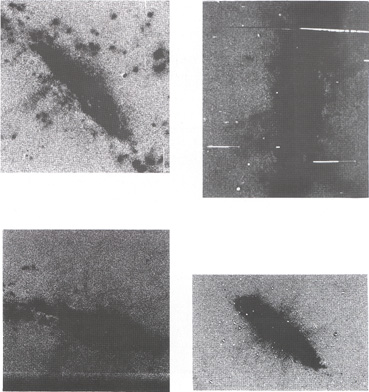
+[NII] images of IR-bright,
edge-on disk galaxies exhibiting large-scale
optical emission-line filaments extending several kpc out of the galaxy
disk and into
the halo. (a) NGC 660; (b) NGC 3079; (c) NGC 3628; and (d) NGC 4666 - see
AHM90;
Fabbiano, Heckman, & Keel
1990;
L92; LH).
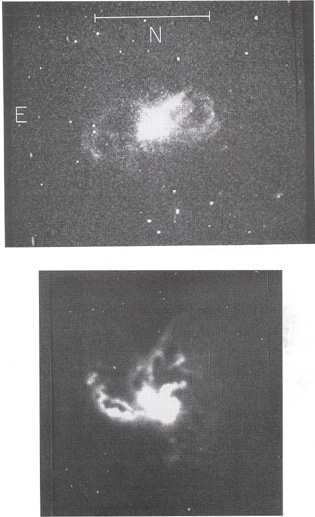
+[NII] images of two galaxies
with IR luminosities greater than 1045 erg
s-1: (a) Arp 220 (from
Heckman, Armus, & Miley
1987)
and (b) Mrk 266 (from
AHM90). These represent the superwind phenomenon at the high-luminosity
end, where the emission-line nebulae are tens of kpc in size
luminosities
and the measured densities allow us to estimate the mass and the
volume-filling
factor of optical emission-line gas. The derived masses range from
105
M to
107
M, and the
volume-filling factors are typically 10-3 to
10-4.
Thus, the emission-line gas represents a modest amount of relatively dense
material distributed in the form of clumps, sheets, or filaments that occupy
only a very small fraction of the volume of the halo of the starburst
galaxy.
and X-ray images are
available, there is a clear correspondence between the two images (e.g.,
Watson, Stanger, &
Griffiths 1984;
Armus, Heckman, & Weaver
1993).
In some cases, the optical line emission is preferentially located along
the outer boundary of the X-ray nebula
(Fabbiano, Heckman, & Keel
1990;
Heckman & Fabbiano 1993;
McCarthy, Heckman, & van
Breugel 1987
- and see
Figure 4). This suggests that the optical line
emission arises at the interface
between the hot superwind and the ambient interstellar gas in the halo of
the starburst galaxy (in good agreement with both the theoretical picture
sketched above and the kinematics of the optical emission-line gas in
several
well-studied cases, as summarized below). New ROSAT images should allow
us to conduct many more such comparisons, in order to better test this
idea.
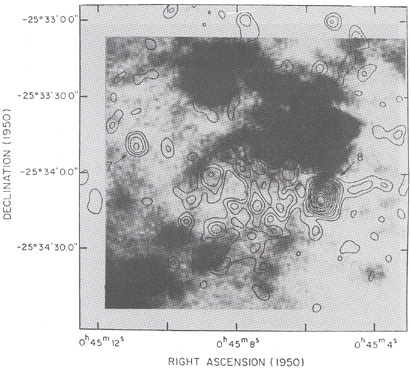
+[N II] image (greyscale) and
Einstein HRI X-ray image
(contour plot) of the central few kpc of the prototypical IR starburst
galaxy NGC 253. The starburst nucleus is located in the upper right
corner. Note how the
filamentary optical line emission to the SE of the nucleus seems to
enclose the X-ray plume (cf.
McCarthy, Heckman, & van
Breugel 1987;
Fabbiano & Trinchieri
1984;
LH; L92).
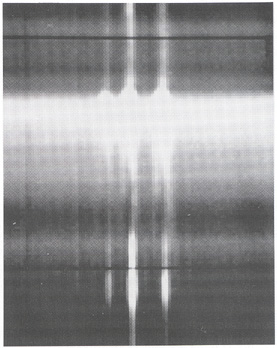
 6548,
H,
[N II]6584
emission-lines in the central few kpc of NGC 253. The slit was oriented
in a position
angle of 135 degrees, along the minor axis of this edge-on galaxy. Note
that each
of the three lines has a double-peaked profile shape throughout a
region about 600
pc in extent to the SE of the nucleus. This line-splitting has a
magnitude of about
300 to 400 km s-1, and suggests either an expanding bubble
or outflow along the
surface of a hollow cone-like structure (cf. HAM). This region of
expanding gas also
corresponds to the bright X-ray plume seen in Fig. 4 (cf.
Fabbiano & Trinchieri
1984;
McCarthy, Heckman, & van
Breugel 1987).
6548,
H,
[N II]6584
emission-lines in the central few kpc of NGC 253. The slit was oriented
in a position
angle of 135 degrees, along the minor axis of this edge-on galaxy. Note
that each
of the three lines has a double-peaked profile shape throughout a
region about 600
pc in extent to the SE of the nucleus. This line-splitting has a
magnitude of about
300 to 400 km s-1, and suggests either an expanding bubble
or outflow along the
surface of a hollow cone-like structure (cf. HAM). This region of
expanding gas also
corresponds to the bright X-ray plume seen in Fig. 4 (cf.
Fabbiano & Trinchieri
1984;
McCarthy, Heckman, & van
Breugel 1987).