


Unlike the situation for stars, gas kinematics are much easier to interpret if the gas participates in Keplerian rotation in a disklike configuration. But there are two caveats to remember. First, gas can be easily perturbed by nongravitational forces (shocks, radiation pressure, winds, magnetic fields, etc.). Indeed, in the case of the Galactic Center, it was precisely this reason that its central mass, which had been estimated for some time using gas velocities (Lacy et al. 1980), could not be accepted with full confidence prior to the measurement of the stellar kinematics. Second, there is no a priori reason that the gas should be in dynamical equilibrium, and therefore one must verify empirically that the velocity field indeed is Keplerian. The optically-emitting ionized gas in the central regions of some spirals show significant noncircular motions (e.g., Fillmore, Boroson, & Dressler 1986). NGC 4594 is a striking example. Kormendy et al. (1997a) showed that the emission-line rotation curve near the center falls substantially below the circular velocities of the stars, and hence the gas kinematics cannot be used to determine the central mass.
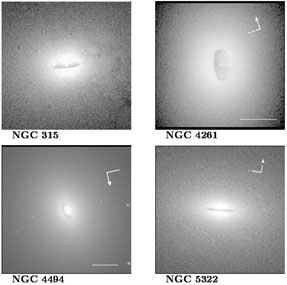
The sharpened resolution of the refurbished HST has revealed many examples of nuclear disks of dust and ionized gas (Fig. 3). The nuclear disks typically have diameters ~ 100-300 pc, with the minor axis often aligned along the direction of the radio jet, if present. Some examples include the elliptical galaxies NGC 4261 (Jaffe et al. 1993), M87 (Ford et al. 1994), NGC 5322 (Carollo et al. 1997), and NGC 315 (Ho et al. 1997), and the early-type spiral M81 (Devereux, Ford, & Jacoby 1997). I will highlight here only three cases; Table 1 gives a complete list of objects and references.
|
Figure 3. Nuclear disks from HST optical images. Each image is 35" on a side. |
The first object for which the nuclear gas disk was used to determine the
central mass was M87.
Harms et al. (1994)
used the FOS to obtain spectra of several positions of the disk and
measured a velocity difference of ± 1000 & km& s-1 at a
radius of 0".25 (18
pc) on either side of the nucleus. Adopting an inclination angle of
42° determined photometrically by
Ford et al. (1994),
the velocities were consistent with Keplerian motions about a central
mass of (2.4± 0.7) × 109
M . Since the implied
M / LV
. Since the implied
M / LV
 500, Harms et
al. concluded that the central mass is
dark, most likely in the form of a SMBH. The case for a SMBH in M87 has
been considerably strengthened through the recent reobservation with
HST by
Macchetto et al. (1997),
who used the long-slit mode of the
Faint Object Camera to obtain higher quality spectra extending to
r = 0".05 (3.5 pc). The velocities in the inner few tenths
of an arcsecond
are well fitted by a model of a thin disk in Keplerian rotation
(Fig. 4),
although the inclination angle is not well constrained (47°-65°).
The rotation curve at larger radii falls below the Keplerian curve,
possibly indicating a warp in the disk
(Macchetto et al. 1997)
or substantial perturbations due to spiral shocks
(Chakrabarti 1995).
For i = 52°, MMDO = (3.2± 0.9) ×
109
M, and M /
LV
500, Harms et
al. concluded that the central mass is
dark, most likely in the form of a SMBH. The case for a SMBH in M87 has
been considerably strengthened through the recent reobservation with
HST by
Macchetto et al. (1997),
who used the long-slit mode of the
Faint Object Camera to obtain higher quality spectra extending to
r = 0".05 (3.5 pc). The velocities in the inner few tenths
of an arcsecond
are well fitted by a model of a thin disk in Keplerian rotation
(Fig. 4),
although the inclination angle is not well constrained (47°-65°).
The rotation curve at larger radii falls below the Keplerian curve,
possibly indicating a warp in the disk
(Macchetto et al. 1997)
or substantial perturbations due to spiral shocks
(Chakrabarti 1995).
For i = 52°, MMDO = (3.2± 0.9) ×
109
M, and M /
LV
 110.
If, instead, a Plummer potential is assumed, the distributed dark mass can
have a core radius no larger than ~ 5 pc. So, in either case, a density
~ 107 M
pc-3 is implied.
110.
If, instead, a Plummer potential is assumed, the distributed dark mass can
have a core radius no larger than ~ 5 pc. So, in either case, a density
~ 107 M
pc-3 is implied.
|
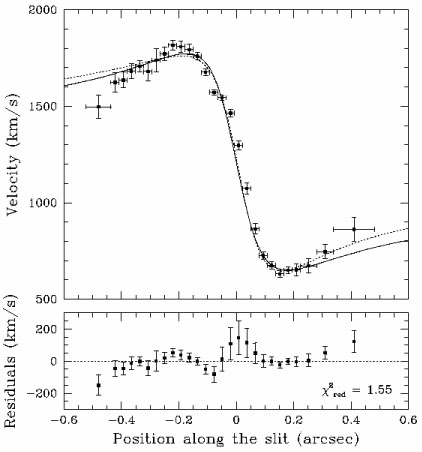
Figure 4. Optical emission-line rotation curve for the nuclear disk in M87. The two curves in the upper panel correspond to Keplerian thin disk models, and the bottom panel shows the residuals for one of the models (see Macchetto et al. 1997). |
The mildly active nucleus of NGC 4261 contains a rotating disk of dust and
ionized gas as well
(Ferrarese, Ford, & Jaffe
1996);
like M87, the disk
is slightly warped and shows traces of weak spiral structure.
Although the FOS data for this object are rather noisy, they indicate
that the gas largely undergoes circular motions. The mass interior
to r = 15 pc is
MMDO = (4.9± 1.0) × 108
M, and
M/LV has an exceptionally high value of 2
× 103.
The installation of the imaging spectrograph STIS in 1997
at long last gives HST an efficient means to obtain spatially
resolved spectra of the central regions of galaxies. Much progress in the
field is anticipated in the near future. A taste of what might
be expected can be seen in the early-release observations of M84
by Bower et al.
(1998;
Fig. 5). M84 is almost a twin of M87 in terms of
luminosity, and its central dark mass (1.5 × 10⁹
M), too, is similar.

|
Figure 5. Optical emission-line rotation curve for the nuclear disk in M84 obtained with STIS on HST (Bower et al. 1998). The kinematics can be well fitted with a thin Keplerian disk model, which is plotted as open circles connected by the solid line. |
Lastly, I mention an interesting, unconventional case. The radio galaxy
Arp 102B belongs to a minority of AGNs that display
so-called double-peaked
broad emission lines. Several ideas have been proposed for the peculiar
line profiles in this class of objects, but the favored explanation is that
the lines originate from a relativistic accretion disk
(Eracleous et al. 1997).
During the course of a long-term optical monitoring
of Arp 102B, the intensity ratio of the two peaks of the
H line
displayed sinusoidal variations with a period of 2.2 years for several
years
(Newman et al. 1997).
The periodic signal was interpreted as
arising from a "hot spot" in the accretion disk. By modeling the
line profile from the epochs when the hot spot was quiescent, one can
estimate the radius and inclination angle of the spot's orbit, and,
combined with its period, the enclosed mass. The mass within r =
0.005 pc turns out to be 2.2 × 10⁸
M, consistent with
a moderately luminous
(MB&
-20 mag) elliptical (see Section 7).
line
displayed sinusoidal variations with a period of 2.2 years for several
years
(Newman et al. 1997).
The periodic signal was interpreted as
arising from a "hot spot" in the accretion disk. By modeling the
line profile from the epochs when the hot spot was quiescent, one can
estimate the radius and inclination angle of the spot's orbit, and,
combined with its period, the enclosed mass. The mass within r =
0.005 pc turns out to be 2.2 × 10⁸
M, consistent with
a moderately luminous
(MB&
-20 mag) elliptical (see Section 7).
4.2. Radio Spectroscopy of Water Masers
Luminous 22-GHz emission from extragalactic water masers are preferentially
detected in galaxies with active nuclei, where physical conditions,
possibly realized in a circumnuclear disk
(Claussen & Lo 1986),
evidently favor this form of maser emission. With the detection in
NGC 4258 of
high-velocity features offset from the systemic velocity by ~ ± 900
& km& s-1
(Nakai, Inoue, & Miyoshi
1993),
Watson & Wallin (1994)
already surmised
that the maser spectrum of this Seyfert galaxy can be interpreted as
arising from a thin Keplerian disk rapidly rotating around a mass of ~
107
M. But the solid
proof of this picture came from the high-resolution
(
 = 0".0006 ×
0".0003; v = 0.2
& km& s-1) VLBA observations of
Miyoshi et al. (1995)
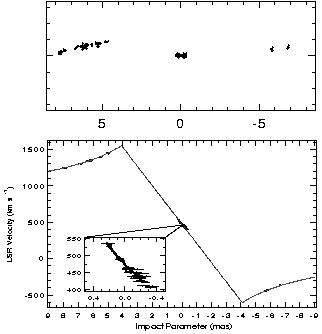
who demonstrated that the maser spots
trace a thin (< 0.003 pc), nearly edge-on annulus with an inner radius
of 0.13 pc and an outer radius of 0.26 pc. The systemic features lie
on the near side of the disk along the line-of-sight to the center
(Fig. 6);
the high-velocity features delineate the edges of the disk on either
side and follow a Keplerian rotation curve to very high accuracy
(
= 0".0006 ×
0".0003; v = 0.2
& km& s-1) VLBA observations of
Miyoshi et al. (1995)
who demonstrated that the maser spots
trace a thin (< 0.003 pc), nearly edge-on annulus with an inner radius
of 0.13 pc and an outer radius of 0.26 pc. The systemic features lie
on the near side of the disk along the line-of-sight to the center
(Fig. 6);
the high-velocity features delineate the edges of the disk on either
side and follow a Keplerian rotation curve to very high accuracy
( 1%). The
implied binding mass within 0.13 pc is 3.6 × 10⁷
M, which
corresponds to a density of > 4 × 10⁹
M
pc-3. In fact, one can
place a tighter constraint on the density. The maximum deviation of the
velocities from a Keplerian rotation curve limits the extent of the central
mass to r
0.012 pc
(Maoz 1995),
from which follows that the density must be > 5 × 10¹²
M pc-3.
1%). The
implied binding mass within 0.13 pc is 3.6 × 10⁷
M, which
corresponds to a density of > 4 × 10⁹
M
pc-3. In fact, one can
place a tighter constraint on the density. The maximum deviation of the
velocities from a Keplerian rotation curve limits the extent of the central
mass to r
0.012 pc
(Maoz 1995),
from which follows that the density must be > 5 × 10¹²
M pc-3.
|
Figure 6. Water maser emission in NGC 4258 (Miyoshi et al. 1995). Top: spatial distribution of the maser features; bottom: rotation curve. Adapted from Greenhill (1997). |
Two, possibly three, additional AGNs have H2O megamasers
suitable for tracing the central potential. The spectrum of the maser
source in the Seyfert nucleus of NGC 1068 also exhibits satellite
features (± 300 & km& s-1) offset from the systemic velocity
(Greenhill et al. 1996).
The redshifted and
blueshifted emission again lie on a roughly linear, 2-parsec feature
passing through the systemic emission
(Greenhill 1998).
The rotation curve in this
instance is sub-Keplerian, possibly because the disk has nonnegligible mass,
and the derived mass (1.7 × 10⁷
M within a radius
of 0.65 pc) is less certain.
The maser in the nucleus of NGC 4945 shows a position and
velocity distribution reminiscent of NGC 4258 as well: high-velocity
features symmetrically straddle the systemic emission.
Greenhill, Moran, &
Herrnstein (1997)
interpret the data, which in this case is
considerably less accurate because of its location in the southern sky,
in terms of an edge-on disk model and derive a central mass of 1.4
× 106
M within r =
0.3 pc. This result is quite surprising because,
as an Scd spiral, NGC 4945 is expected to be essentially bulgeless. If
the dark mass in its center is truly in the form of a SMBH, then SMBHs
evidently can form without a bulge.
The H2O megamaser source in NGC 3079 is potentially useful
for mass determination. Here, however, the complex spatial distribution
of the emission regions and the large intrinsic widths of the lines
complicate the analysis, and the interpretation of the data may not be
unique.
Trotter et al. (1998)
tentatively assign a central mass of 1 × 10⁶
M to this galaxy.
4.3. Determining Central Masses of Active Galactic Nuclei
I mention one other method for determining masses in the central regions of galaxies, specifically in AGNs. Although AGNs largely provide the motivation for searching for SMBHs, ironically it is precisely in these objects that conventional techniques used to measure masses fail. The bright continuum emission of the active nucleus nearly always completely overpowers the stellar absorption lines near the center, and in many cases the narrow emission lines are significantly affected by nongravitational forces.
An approach taken in the past attempts to utilize the
broad [(1-few) × 103 & km& s-1] emission
lines that are thought to arise
from the so-called broad-line region (BLR), a tiny, dense region
much less than a parsec from the central source. Assuming that the line
widths trace gravity, the mass follows from
 v2rBLR / G, where
1-3 depending on the
kinematic model adopted. The BLR radius has traditionally been estimated
from photoionization arguments (e.g.,
Dibai 1980;
Wandel & Yahil 1985;
Wandel & Mushotzky 1986;
Padovani, Burg, & Edelson
1990),
but recent variability studies indicate that the BLR is much more
compact than previously thought
(Netzer & Peterson 1997).
v2rBLR / G, where
1-3 depending on the
kinematic model adopted. The BLR radius has traditionally been estimated
from photoionization arguments (e.g.,
Dibai 1980;
Wandel & Yahil 1985;
Wandel & Mushotzky 1986;
Padovani, Burg, & Edelson
1990),
but recent variability studies indicate that the BLR is much more
compact than previously thought
(Netzer & Peterson 1997).
|
The continuum output from AGNs typically varies on timescales ranging from days to months in the UV and optical bands. Because the emission lines are predominantly photoionized by the central continuum, they vary in response to the changes in the continuum, but with a time delay (lag) that corresponds to the light-travel distance between the continuum source and the line-emitting gas. "Reverberation mapping" (Blandford & McKee 1982), therefore, in principle allows one to estimate the luminosity-weighted radius of the BLR, although in practice the complex geometry and ionization structure of the BLR complicate the interpretation of the "sizes" derived by this method (see Netzer & Peterson 1997 for a recent review).
If the widths of the broad emission lines reflect bound gravitational
motions, as seems to be the case in most well-studied objects
(Netzer & Peterson 1997;
but see
Krolik 1997),
then, adopting a reasonable kinematic model
(e.g., randomly moving clouds), the virial mass can be
estimated from v2rBLR /
G. If, instead, the clouds are
infalling, as has been claimed in some cases, the mass will be smaller by a
factor of 2. One of the uncertainties in the application of this simple
formalism lies in the choice of v. What is appropriate? One
reasonable choice might be v =
( 3 / 2)FWHM, the full width at
half-maximum of a
representative broad line. Yet another ambiguity is which line to use,
since not all broad emission lines have the same widths. Ultraviolet or
high-ionization lines, for instance, generally have broader profiles than
optical or low-ionization lines. For the purposes of this exercise, I
simply chose the line for which the most data exist
(H
3 / 2)FWHM, the full width at
half-maximum of a
representative broad line. Yet another ambiguity is which line to use,
since not all broad emission lines have the same widths. Ultraviolet or
high-ionization lines, for instance, generally have broader profiles than
optical or low-ionization lines. For the purposes of this exercise, I
simply chose the line for which the most data exist
(H ) in order to obtain
as large a sample as possible.
) in order to obtain
as large a sample as possible.
|
Table 2 lists the derived masses for the 17 Seyfert 1 galaxies that have been monitored extensively in the optical; eight of the objects appear in the compilation of Peterson et al. (1998). Since the masses of MDOs derived from gas and stellar kinematics show a loose correlation with the bulge or spheroidal luminosity of the host galaxies (Section 7; Fig. 8 a), we can ask whether those derived from reverberation mapping follow such a correlation. I have estimated the B-band luminosities of the bulges of the Seyferts based on published surface photometry of the host galaxies (taking care to exclude the contribution of the AGN itself, which often can be significant). Figure 8 b indicates that, at a fixed bulge luminosity, the masses from reverberation mapping are systematically lower than the masses obtained using conventional techniques, on average by about a factor of 5. It is encouraging that this admittedly crude method of mass estimation is not too far off the mark. Notably, the scatter of MMDO at a fixed luminosity is quite comparable in the two samples, and the constant offset suggests that one of the underlying assumptions in the mass estimate is incorrect. Since the line width affects the mass quadratically, it is conceivable that some measure of the line profile other than the FWHM is more appropriate.