


The same colour calibration was used to match our spectra to existing optical and UV ones to obtain a single template from 0.1 to 2.4 µm. Several optical templates are available in the literature (Coleman et al., 1980; Kennicutt, 1992a, 1992b; K96). In order to obtain meaningful results, the optical spectra must have appropriate resolution and wavelength coverage, should be based on a relatively large number of galaxies and the used spectroscopic aperture must be similar to our one. Among the available optical templates, only the K96 spectra have the required features: 1- they have a high enough resolution (between 6 and 10Å) for most studies of stellar populations; 2- have the largest wavelength coverage, extending from 1200 Å up to about 1 µm, at the edge of the J band (the Sc spectrum covers only up to 7700Å); 3- use an aperture of 10 × 20" at all the wavelengths, similar to ours. 4- are based on the observations of 30 galaxies, 12 of which in common to our sample.
While below 7000Å the K96 spectra closely reproduce the observed colours of Table 2, above this wavelength the K96 spectra are much redder. The difference is not due to the chosen colours (effective aperture and MV < -21) because the K96 spectra don't fit the average colours inside any aperture and for any magnitude (see, for example, Goudfrooij, 1994). Moreover, they don't reproduce the colours of the observed galaxies: as an example, all 4 elliptical galaxies in K96 have observed Johnson's V-I colours between 1.38 and 1.45 for apertures between 10 and 20" (Prugniel & Hèraudeau, 1998), while the colour derived from the K96 spectrum is 1.59. It should also be noted that above 7000Å the K96 spectra are quite different from those by Coleman et al. (1980) who also corrected the spectra for the observed colours. No useful comparison can be done with the Kennicutt (1992a, 1992b) atlas because it only covers the spectra region below 7000Å.
In order to have a self-consistent template we have to apply some corrections to the optical spectra to make them fit the colours. The procedure is shown in Fig. 5 where the K96 spectrum for the ellipticals is plotted against the colours of Table 2 used both to calibrate the near-IR spectra and to correct the K96 templates. The correction to the K96 spectra was computed by the ratio of two splines, fitted respectively to the observed colours and to the colours derived from the spectra (see Figure 5). This correction is not unique, but the availability of data in many filters maintains this uncertainty below the other ones.

|
Figure 5. Colour correction to the K96 spectra. The dotted lines show the K96 spectrum for the ellipticals and a spline fit to the corresponding photometric points. (empty dots). The solid dots show the effective colours of the galaxies of this class with MV < -21 (see Table 2), the solid lines are the fit to these data and the final spectrum, corrected to fit the colours. |
For all the K96 spectra between E and Sb, a good agreement
(within a few percent) is present below 7000Å between the optical
spectra and the average colours, and the corrections are small.
On the contrary,
the Sc spectrum, based on two galaxies only, appears to be much bluer
than the expected colours of its class even at
 < 7000 Å.
Also the equivalent widths of the emission lines
are much larger than in the galaxies of our sample, about 296Å for the
H
< 7000 Å.
Also the equivalent widths of the emission lines
are much larger than in the galaxies of our sample, about 296Å for the
H +[NII] vs. an average of
41Å for our galaxies
(Kennicutt & Kent,
1983)
and 54Å for the Sc sample by
Kennicutt (1992a).
We think that both these effects are
probably due to the fact that the two Sc galaxies in the K96 sample,
NGC 598 and NGC 2403, are of
later type (T = 5.6 and 5.7) then the average Sc (T = 5.0, from
Buta et al., 1994)
and those in our sample (T = 4.7).
To correct for this, we have both applied the colour correction, as for
the other types, and also scaled down the emission line to have
the same EW of our sample.
The resulting spectrum, although representative of an
average Sc galaxy, should be
used with caution when comparing optical to near-IR features and when
dealing with the emission lines, also because of its lower SNR.
+[NII] vs. an average of
41Å for our galaxies
(Kennicutt & Kent,
1983)
and 54Å for the Sc sample by
Kennicutt (1992a).
We think that both these effects are
probably due to the fact that the two Sc galaxies in the K96 sample,
NGC 598 and NGC 2403, are of
later type (T = 5.6 and 5.7) then the average Sc (T = 5.0, from
Buta et al., 1994)
and those in our sample (T = 4.7).
To correct for this, we have both applied the colour correction, as for
the other types, and also scaled down the emission line to have
the same EW of our sample.
The resulting spectrum, although representative of an
average Sc galaxy, should be
used with caution when comparing optical to near-IR features and when
dealing with the emission lines, also because of its lower SNR.
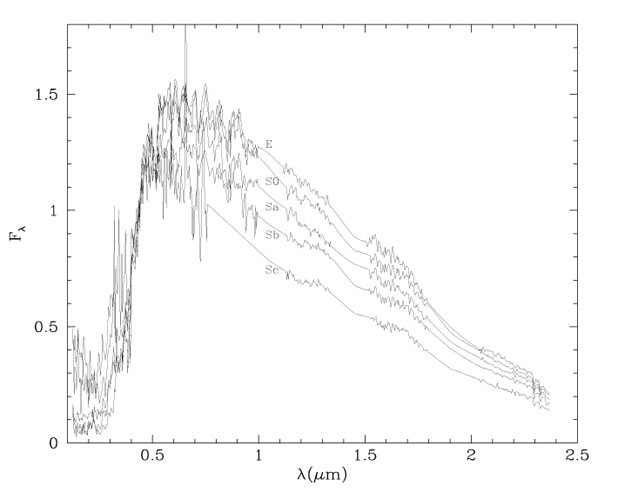
As final step, the spectra were arbitrarily interpolated across the wavelength ranges where the atmosphere is not transparent. In Figure 6 we show at a reduced resolution the final spectra reproducing the observed effective colours.
|
Figure 6. Template spectra for E, S0, Sa, Sb and Sc galaxies. The spectra were reduced to a resolution of 40Å and normalized to the B band. The interpolation between the bands is arbitrary. |
The relatively small apertures used for both spectroscopy and photometry means that the spectra in Figure 6 are representative of the central regions of the galaxies containing about half of the total emission. K96 compare their optical spectra with those by Kennicutt (1992b) obtained using a much larger aperture (about 90 × 90") and conclude that for E, S0 and Sa the K96 spectra are in fact representative of the total emission of the galaxies because their integrated properties are dominated by the central bulge. The same argument applies in the near-IR too, and in this case a weaker dependence of the spectra from the aperture is also predicted: in fact, while in the optical the young population in the upper main sequence can easily dominate, in the near-IR any shortly living super-giants population must compete with the usually much more numerous giants population and therefore dominates only in case of strong activity of star formation. As discussed in the sec. 3, this can be checked comparing near-IR spectra extracted from the inner and outer regions of the galaxies, or from large and small objects. A weaker variation of the near-IR spectra with aperture with respect to the optical spectra can also be predicted from the colours: the J-H and H-K colours are only weakly dependent of the galaxy type (see Table 2) and do not show significant radial gradients (Glass 1984; Fioc & Rocca-Volmerange, 1999), not even for the late type galaxies. Therefore we conclude that for the early type galaxies the spectra in Figure 6 can also be used as templates of the integrated galaxy. For Sb and Sc galaxy, younger extra nuclear populations can change the spectra significantly, both in the optical because of the stars of the upper main sequence and in the near-IR if an important population of red supergiants is present.