


 m
m
The present author, like many theorists, has long regarded the
Einstein-de Sitter
(m = 1,
 = 0) cosmology as the most
attractive one. For one thing, of the three possible constant
values for - 0, 1, and
= 0) cosmology as the most
attractive one. For one thing, of the three possible constant
values for - 0, 1, and
 - the only one
that can describe our universe is
m = 1. Also, cosmic
inflation is the only known solution for several otherwise intractable
problems, and all simple inflationary models predict that the universe
is flat, i.e. that
m + = 1. Since there is no
known physical reason for a non-zero cosmological constant, it was
often said that inflation favors
= 1. Of course, theoretical
prejudice is not a reliable guide. In recent years, many cosmologists
have favored
m ~ 0.3, both
because of the H0 - t0
constraints and because cluster and other relatively small-scale
measurements have given low values for
m. (For a summary of
arguments favoring low
- the only one
that can describe our universe is
m = 1. Also, cosmic
inflation is the only known solution for several otherwise intractable
problems, and all simple inflationary models predict that the universe
is flat, i.e. that
m + = 1. Since there is no
known physical reason for a non-zero cosmological constant, it was
often said that inflation favors
= 1. Of course, theoretical
prejudice is not a reliable guide. In recent years, many cosmologists
have favored
m ~ 0.3, both
because of the H0 - t0
constraints and because cluster and other relatively small-scale
measurements have given low values for
m. (For a summary of
arguments favoring low
 0.2 and
= 0, see
[26];
[32]
is a review that notes that larger scale measurements favor higher
m.)
But the most exciting new evidence has come from
cosmological-scale measurements.
0.2 and
= 0, see
[26];
[32]
is a review that notes that larger scale measurements favor higher
m.)
But the most exciting new evidence has come from
cosmological-scale measurements.
Type Ia Supernovae. At present, the most promising techniques
for measuring
m and
on cosmological scales
use the small-angle anisotropies in the CMB radiation and
high-redshift Type Ia supernovae (SNe Ia). We will discuss the latter
first. SNe Ia are the brightest supernovae, and the spread in their
intrinsic brightness appears to be relatively small. The Supernova
Cosmology Project
[90]
demonstrated the feasibility of
finding significant numbers of such supernovae. The first seven high
redshift SNe Ia that they analyzed gave for a flat universe
m = 1 -
=
0.94+0.34-0.28, or equivalently
=
0.06+0.28-0.34 (< 0.51 at the 95% confidence
level)
[90].
But adding one z = 0.83 SN Ia for which they
had good HST data lowered the implied
m to 0.6±0.2 in the
flat case
[91].
Analysis of their larger dataset of 42
high-redshift SNe Ia gives for the flat case
m =
0.28+0.09 + 0.05-0.08 - 0.04 where the first
errors are statistical and the second are identified systematics
[92].
The High-Z Supernova
team has also searched successfully for high-redshift supernovae to
measure m
[48,
104],
and their 1998 dataset of 14 + 2
high-redshift SNe Ia including three for which they had HST data (two
at z 0.5 and one
at 0.97) imply m
= 0.32±0.1 in the flat case with their MLCS fitting method.
The main concerns about the interpretation of this data are evolution
of the SNe Ia
[34,
106]
and dimming by dust. A recent
specific supernova evolution concern is that the rest frame rise-times
of distant supernovae may be longer than nearby ones
[105].
But a direct comparison between nearby supernova and the SCP distant
sample shows that they are rather consistent with each other
[2].
Ordinary dust causes reddening, but hypothetical ``grey''
dust would cause much less reddening and could in principle provide an
alternative explanation for the fact that high-redshift supernovae are
observed to be dimmer than expected in a critical-density cosmology.
Grey interstellar dust would induce more dispersion than is observed,
so the hypothetical grey dust would have to be intergalactic. It is
hard to see why the largest dust grains, which would be greyer, should
preferentially be ejected by galaxies
[118].
Such dust, if it exists, would also absorb starlight and reradiate it at long
wavelengths, where there are other constraints that could, with
additional observations, rule out this scenario
[1].
Such grey
dust would also produce some reddening which could be detectable via
comparison of infrared vs. optical colors of supernovae; such a
measurement for one high-redshift SN Ia disfavors significant grey
dust extinction
[107],
and more observations could strengthen
this conclusion. Yet another way of addressing this question is to
collect data on supernovae with redshift z > 1, where the dust
scenario predicts considerably more dimming than the
cosmology. The one z > 1 supernova currently available, SCP's
``Albinoni'' (SN1998eq) at z = 1.2, favors the
cosmology.
More such data are needed for a statistically significant result, and
both the SCP and the High-Z group are attempting to get a few more
very high redshift supernovae.
CMB anisotropies. The location of the first acoustic (or
Doppler, or Sakharov) peak at angular wavenumber
l 200
indicated by the data available at the time of this meeting was
evidence in favor of a flat universe
tot
 m +
1 (e.g.
[33]).
New data from the BOOMERANG long-duration balloon flight around Antarctica
[30]
and the MAXIMA-1 balloon flight
[54]
confirm this, with
tot =
1.11+0.13-0.12 at 95% C.L.
[59].
The preliminary BOOMERANG results
[30]
are lower around
l 500 than the
predictions in this second peak region in
CDM-type models (e.g.,
[57]),
and this could
[75] indicate
higher b than
expected from Big Bang Nucleosynthesis together
with the recent deuterium measurements (discussed below). However,
the MAXIMA-1 data for
l 500 are more
consistent with expectations of standard models and the standard BBN
b
[5]
(but cf.
[59]).
The BOOMERANG and MAXIMA-2 data are still being
analyzed, and other experiments will have relevant data as well.
Further data should be available in 2001 from the NASA Microwave
Anisotropy Probe satellite.
m +
1 (e.g.
[33]).
New data from the BOOMERANG long-duration balloon flight around Antarctica
[30]
and the MAXIMA-1 balloon flight
[54]
confirm this, with
tot =
1.11+0.13-0.12 at 95% C.L.
[59].
The preliminary BOOMERANG results
[30]
are lower around
l 500 than the
predictions in this second peak region in
CDM-type models (e.g.,
[57]),
and this could
[75] indicate
higher b than
expected from Big Bang Nucleosynthesis together
with the recent deuterium measurements (discussed below). However,
the MAXIMA-1 data for
l 500 are more
consistent with expectations of standard models and the standard BBN
b
[5]
(but cf.
[59]).
The BOOMERANG and MAXIMA-2 data are still being
analyzed, and other experiments will have relevant data as well.
Further data should be available in 2001 from the NASA Microwave
Anisotropy Probe satellite.
Large-scale Measurements. The comparison of the IRAS redshift
surveys with POTENT and related analyses typically give values for the
parameter
 I
m0.6 /
bI (where bI is the
biasing parameter for IRAS galaxies), corresponding to 0.3
I
m0.6 /
bI (where bI is the
biasing parameter for IRAS galaxies), corresponding to 0.3
 m
3 (for an assumed
bI = 1.15). It is not clear
whether it will be possible to reduce the spread in these values
significantly in the near future -- probably both additional data and
a better understanding of systematic and statistical effects will be
required. A particularly simple way to deduce a lower limit on
m from the POTENT
peculiar velocity data was proposed by
[31],
based on the fact that high-velocity outflows from voids
are not expected in low-
models. Data on just one nearby void indicates that
m
m
3 (for an assumed
bI = 1.15). It is not clear
whether it will be possible to reduce the spread in these values
significantly in the near future -- probably both additional data and
a better understanding of systematic and statistical effects will be
required. A particularly simple way to deduce a lower limit on
m from the POTENT
peculiar velocity data was proposed by
[31],
based on the fact that high-velocity outflows from voids
are not expected in low-
models. Data on just one nearby void indicates that
m
 0.3 at the 97% C.L. Stronger
constraints are available if we assume that the probability
distribution function (PDF) of the primordial fluctuations was
Gaussian. Evolution from a Gaussian initial PDF to the non-Gaussian
mass distribution observed today requires considerable gravitational
nonlinearity, i.e. large
m. The PDF
deduced by POTENT from
observed velocities (i.e., the PDF of the mass, if the POTENT
reconstruction is reliable) is far from Gaussian today, with a long
positive-fluctuation tail. It agrees with a Gaussian initial PDF if
and only if
m ~ 1;
m < 1 is
rejected at the
2
0.3 at the 97% C.L. Stronger
constraints are available if we assume that the probability
distribution function (PDF) of the primordial fluctuations was
Gaussian. Evolution from a Gaussian initial PDF to the non-Gaussian
mass distribution observed today requires considerable gravitational
nonlinearity, i.e. large
m. The PDF
deduced by POTENT from
observed velocities (i.e., the PDF of the mass, if the POTENT
reconstruction is reliable) is far from Gaussian today, with a long
positive-fluctuation tail. It agrees with a Gaussian initial PDF if
and only if
m ~ 1;
m < 1 is
rejected at the
2 level, and
m
level, and
m
 0.3 is ruled out at
4
[87,
10].
It would be interesting to repeat this analysis with
newer data. Analyzing peculiar velocity data without POTENT again
leads to a strong lower limit
m > 0.3 (99%
C.L.), and together
with the SN Ia constraints leads to the conclusion that
m
0.5
[136].
0.3 is ruled out at
4
[87,
10].
It would be interesting to repeat this analysis with
newer data. Analyzing peculiar velocity data without POTENT again
leads to a strong lower limit
m > 0.3 (99%
C.L.), and together
with the SN Ia constraints leads to the conclusion that
m
0.5
[136].
Measurements on Scales of a Few Mpc. A study by the Canadian
Network for Observational Cosmology (CNOC) of 16 clusters at z ~
0.3, mostly chosen from the Einstein Medium Sensitivity Survey
[55],
was designed to allow a self-contained measurement of
m from a field
M/L which in turn was deduced from their
measured cluster M/L. The result was
m = 0.19±0.06
[18].
These data were mainly compared to
standard CDM models, and they appear to exclude
m = 1 in such
models.
Estimates on Galaxy Halo Scales. Work by Zaritsky et al.
[133]
has confirmed that spiral galaxies have massive halos. They collected
data on satellites of isolated spiral galaxies, and concluded that the
fact that the relative velocities do not fall off out to a separation
of at least 200 kpc shows that massive halos are the norm. The
typical rotation velocity of
~ 200 - 250 km s-1 implies a mass
within 200 kpc of ~ 2 × 10¹²
M . A careful
analysis
taking into account selection effects and satellite orbit
uncertainties concluded that the indicated value of
m exceeds
0.13 at 90% confidence
[135],
with preferred
values exceeding 0.3. Newer data suggesting that relative velocities
do not fall off out to a separation of ~ 400 kpc
[134]
presumably would raise these
m estimates. Weak
lensing data confirms the existence of massive galactic halos
[116,
125,
4,
131].
. A careful
analysis
taking into account selection effects and satellite orbit
uncertainties concluded that the indicated value of
m exceeds
0.13 at 90% confidence
[135],
with preferred
values exceeding 0.3. Newer data suggesting that relative velocities
do not fall off out to a separation of ~ 400 kpc
[134]
presumably would raise these
m estimates. Weak
lensing data confirms the existence of massive galactic halos
[116,
125,
4,
131].
Cluster Baryons vs. Big Bang Nucleosynthesis. White et al.
[128]
emphasized that X-ray observations of the abundance of baryons
in clusters can be used to determine
m if clusters are a fair
sample of both baryons and dark matter, as they are expected to be
based on simulations
[38].
The fair sample hypothesis implies that
| (1) |
We can use this to determine
m using the
baryon abundance
b
h2 = 0.019±0.0024 (95% C.L.) from the measurement
of the deuterium abundance in high-redshift Lyman limit systems, of which
a third has recently been analyzed
[66,
122]
and more are in
the pipeline D. Tytler, these proceedings. Using X-ray data from an
X-ray flux limited sample of clusters to estimate the baryon fraction
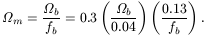
fb = 0.075h-3/2
[84]
gives m =
0.25h-1/2 = 0.3±0.1 using
h = 0.65±0.08. Estimating the baryon fraction
using Sunyaev-Zel'dovich measurements of a sample of 18 clusters gives
fb = 0.077h-1
[19],
and implies m =
0.25h-1 = 0.38±0.1.
Cluster Evolution. The dependence of the number of clusters on
redshift can be a useful constraint on theories
[36].
But the cluster data at various redshifts are difficult to
compare properly since they are rather inhomogeneous. Using just
X-ray temperature data,
[37]
concludes that
m
0.45±0.2, with
m = 1 strongly
disfavored.
Power Spectrum. In the context of the
CDM class of models,
two additional constraints are available. The spectrum shape
parameter  m h
0.25±0.05, implying
m
0.4±0.1. A new
measurement
m = 0.34±0.1
comes from the amplitude of the power spectrum of fluctuations at
redshift z ~ 3, measured from the Lyman
m h
0.25±0.05, implying
m
0.4±0.1. A new
measurement
m = 0.34±0.1
comes from the amplitude of the power spectrum of fluctuations at
redshift z ~ 3, measured from the Lyman
 forest
[127].
This result is strongly inconsistent with
high-m models
because they would predict that the
fluctuations grow much more to z = 0, and thus would be lower at
z = 3 than they are observed to be.
forest
[127].
This result is strongly inconsistent with
high-m models
because they would predict that the
fluctuations grow much more to z = 0, and thus would be lower at
z = 3 than they are observed to be.