


The history of the measurement of distances using globular clusters can be broken into four eras.
The measurement of the brightest globular clusters in M87 by Baum (1955) and Racine (1968) launched the first era. Ironically, given the recent history of the distance scale question, Sandage (1968) found H0 = 75 km s-1 Mpc-1 using the first-ranked globular cluster in M87 while de Vaucouleurs (1970) found H0 = 50 km s-1 Mpc-1. It was clearly recognized that size-of-sample effects introduced large uncertainties in these estimates.
During the 70s, deeper photographic observations allowed comparisons of
the bright side of the luminosity function (e.g.
Hanes 1977,
20 galaxies in the Virgo cluster down to
V  21.6 mag;
Strom et al. 1981,
1700 clusters in M87 to B
23.5 mag), eventually leading
to the development of sophisticated maximum-likelihood techniques for
comparing distributions (e.g.
Hanes & Whittaker 1987,
Seeker & Harris 1993).
While this dramatically improved the accuracy (in fact Hanes & Whittaker
argue that "there is no need to strive for much deeper levels"), the
results were still sensitive to the unknown width of
the distribution which was not well constrained by the data.
21.6 mag;
Strom et al. 1981,
1700 clusters in M87 to B
23.5 mag), eventually leading
to the development of sophisticated maximum-likelihood techniques for
comparing distributions (e.g.
Hanes & Whittaker 1987,
Seeker & Harris 1993).
While this dramatically improved the accuracy (in fact Hanes & Whittaker
argue that "there is no need to strive for much deeper levels"), the
results were still sensitive to the unknown width of
the distribution which was not well constrained by the data.
The availability of CCD detectors in the 80's opened the third era, with the number of measured GCLF increasing rapidly (e.g. van den Bergh, Pritchet, & Grillmair 1985, Bridges, Hanes, & Harris 1991, Harris et al. 1991, Ajhar, Blakeslee, & Tonry 1994, Blakeslee & Tonry 1996, Kohle et al. 1996). Some of these observations reached the turnover or just past the turnover, providing more secure measurements by allowing a determination of the peak of the distribution.
The faint limiting magnitude of the Hubble Space Telescope now makes it possible to routinely reach two or three magnitudes beyond the turnover at the distance of the Virgo cluster (e.g. Whitmore et al. 1995, Elson & Santiago 1996a, b, Forbes 1996a, b), hence opening the fourth era. Even the Coma cluster is within our reach, although only barely if we wish to reach past the peak of the luminosity function (Baum et al. 1995). The primary improvements that can be expected from HST observations are; more accurate determinations of the peak and width of the GCLF, higher precision color measurements which may be necessary for separating red (metal rich) and blue (metal poor) clusters, the opportunity to increase the number of local calibrators using HST observations of Cepheids in galaxies as distant as the Virgo and Fornax clusters, and a determination of the degree to which the GCLF is universal.
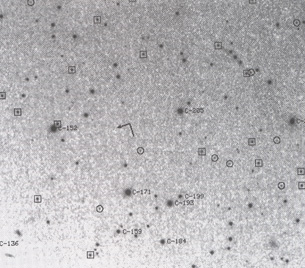
The Hubble Space Telescope (HST) provides several advantages over ground-based telescopes for measuring the GCLF. The first is the ability to reach more than two magnitudes past the turnover for single orbit observations in the Virgo cluster. Another important advantage is the ability to differentiate the globular clusters, which are barely resolved at the distance of the Virgo cluster, from both foreground stars and background galaxies. Finally, the excellent spatial resolution makes it possible to use very small apertures which reduces the effect of the galaxy background, resulting in higher precision observations right into the core of the galaxy where the density of clusters is highest. Figure 1 shows an example of an HST image of a portion of M87 (Whitmore et al. 1995). The large improvement over the ground-based observations (i.e. the objects labeled "C" from Couture, Harris, & Allwright 1990) is readily apparent.
|
Figure 1. A portion of the M87 field from Whitmore et al. (1995) showing how much deeper HST observations are compared to ground-based. The objects labeled "C" are from the ground-based observations of Couture et al. (1990). The squares show clusters with luminosities near the peak of the luminosity function while the circles show clusters roughly 1.5 mag past the peak. |
It is interesting that the first study using HST observations to attempt
to determine the Hubble constant using the GC's was the most difficult
to date.
Baum et al. (1995)
attempted to measure the turnover in the GCLF for the non-central
elliptical galaxy
NGC 4881 in the Coma cluster, with a distance modulus roughly 3.7
magnitudes fainter than the Virgo cluster. They were unable to see any
turnover in the distribution, and
therefore only quote an upper limit for the Hubble constant of
H0 = 67 (+7, -67) km s-1
Mpc-1. However, this is somewhat misleading since they
clearly see the bright end of
the distribution, so very low values of H0 are not
possible. If we assume a GCLF similar to M87
(Whitmore et al. 1995),
a value of M0V = -7.21 mag
(Section 3.1), and use the bright
half of the distribution to estimate the total number of clusters, we
find the value of mV
at 5% of the distribution yields a positive detection of
H0 = 72 ± 13 km s-1 Mpc-1,
rather than an upper limit. It is not unexpected that the turnover was
not seen, since the 50% detection threshold was at mV = 27.3
mag while the peak is predicted at a value
m0V
27.8 mag for this value of H0. In addition, the
observations were made before the
WFPC2 was cooled, hence the number of hot pixels is very large. While
Baum et al. attempt to take these limitations into account, the
observations are clearly pushing the
limit of this particular dataset. It should be possible to observe
roughly one magnitude deeper by using the WFPC2 after the cooldown and
by using spatial dithering to flatten the background and remove hot pixels.
The HST observations of M87 by
Whitmore et al. (1995)
reached more than 2 magnitudes beyond the turnover of the GCLF. With
over 1000 clusters in the sample this
currently represents the best GCLF available for any galaxy, providing
statistical accuracies roughly a factor of two smaller than any
previously measured galaxy, including
the Milky Way and M31 which have much smaller populations. A Gaussian
profile with m0V = 23.72 ± 0.06 mag and
 = 1.40 ± 0.06 mag
provide a good fit to the data, leading
to an estimate for the Hubble constant of H0 = 78
± 11 km s-1 Mpc-1. The color
distribution is strongly bimodal, with peaks near V - I = 0.95
mag and 1.20 mag. This
raises the question of whether the red and blue clusters have the same
value of M0V.
= 1.40 ± 0.06 mag
provide a good fit to the data, leading
to an estimate for the Hubble constant of H0 = 78
± 11 km s-1 Mpc-1. The color
distribution is strongly bimodal, with peaks near V - I = 0.95
mag and 1.20 mag. This
raises the question of whether the red and blue clusters have the same
value of M0V.
Elson & Santiago (1996a, b) observed fields in M87 roughly 2.5' from the center. Although their samples are smaller (146 and 220 clusters), their results are consistent with those of Whitmore et al. (1995). In particular, Elson & Santiago (1996b) find a bimodal color distribution with even sharper peaks at V - I = 0.92 mag and 1.23 mag. They find that the red clusters are roughly 0.3 magnitudes fainter than the blue clusters (see Section 3.2.3 for a discussion).
Forbes et al. (1996) and Forbes (1996a, b) have used HST to study GCs in 14 elliptical galaxies with kinematically-distinct cores. The GCLF of three galaxies (NGC 4365 in either the Virgo cluster or possibly the Virgo W' cloud, and NGC 4278 and NGC 4494 in the Coma I Cloud) have been determined and used to produce estimates of the Hubble constant in the range 72 - 80 km s-1 Mpc-1. However, questions concerning membership and peculiar velocities of these clouds limit the reliability of these estimates.
Whitmore et al. (1996),
as part of their study of candidate young and intermediate-age
globular clusters in merger remnants, find that the old, metal-poor
population of globular
clusters in most galaxies have remarkably constant colors with mean
values of V - I =
0.95 mag (i.e. the Milky Way, M31, ellipticals with narrow color
distributions, the blue
peak of ellipticals with bimodal color distributions, and the old
populations in merger remnants). Following the suggestion by
Zepf and Ashman (1993),
they argue that the red clusters found in some ellipticals (e.g.
M87) are metal-rich GC's formed in a second
episode of cluster formation, presumably during a merger event. This may
be important
for distance measurements since red and blue clusters may have slightly
different values
of M0V. They also find that the bright wing of the
GCLF for five galaxies observed with
HST is remarkably constant, with a scatter of just 0.1 mag, indicating
that fairly good
distance estimates can be determined as long as the completion limit
reaches mV -8
mag. This is similar to the conclusion of
Hanes & Whittaker (1987).
For HST, with a limiting magnitude around mV = 29 mag, this
implies a distance modulus of 37 mag and a distance of 250 Mpc.
Elson, Santiago, & Gilmore
(1996)
have shown that globular clusters can be seen out to a distance modulus
of 39 mag in the Hubble Deep Field.
2.3. A compilation and estimate of the intrinsic dispersion in M0V
A Gaussian distribution provides a good representation of the GCLF for
most galaxies when plotted in magnitude bins (e.g.
Hanes 1977,
Harris 1991,
Jacoby et al. 1992;
however, see
Secker 1992, and
Kissler et al. 1994,
who argue that a t distribution with
a shape parameter µ = 5 is a slightly better fit to the Milky Way
and M31 GCLFs).
Figure 2 shows the data for M87 from
Whitmore et al.
(1995;
see also Figure 7 in
Jacoby et al. 1992).
The two primary quantities that will be compiled are,
m0V, the extinction
corrected apparent magnitude of the turnover of the GCLF in the Johnson
V passband,
and , the standard deviation
or "width" of the distribution.

|
Figure 2. The GCLF for M87 from Whitmore et al. (1995) showing that a Gaussian profile provides a good fit. |
Tables 1 and 2 provide a
compilation of m0V and
for 18 giant elliptical
galaxies deemed of high enough quality to provide estimates with
uncertainties less than about 0.3 mag. See H96 for a compilation of
GCLFs for spirals and dwarf galaxies, and a plot of
M0V vs. galaxy, luminosity.
Table 1 shows that m0V (and
therefore M0V) is remarkably
constant, with a raw scatter of 0.21 mag for the Virgo cluster (0.24 mag
if NGC 4365 and NGC 4636 are included), and 0.18 in the Fornax cluster.
| m0V | ± |
| ± | Reference | |
| Fornax Cluster | |||||
| NGC 1344 | 23.80 | 0.25 mag | 1.35 | 0.18 mag | Blakeslee & Tonry (1996) |
| NGC 1374 | 23.52 | 0.14 | - | - | Kohle et al. (1996) |
| NGC 1379 | 23.68 | 0.28 | - | - | Kohle et al. (1996) |
| NGC 1380 | 24.05 | 0.25 | 1.30 | 0.17 | Blakeslee & Tonry (1996) |
| NGC 1399 | 23.81 | 0.09 | - | - | *** weighted mean *** |
| " | 23.90 | 0.08 | - | - | Kohle et al. (1996) |
| " | 23.83 | 0.15 | 1.38 | 0.09 | Blakeslee & Tonry (1996) |
| " | 23.85 | 0.30 | (1.4) | - | Bridges et al. (1991) |
| " | 23.45 | 0.16 | 1.20 | - | Geisler & Forte (1990) |
| " | 24.00 | 0.20 | - | - | Madejsky & Bender (1990) |
| NGC 1404 | 24.01 | 0.14 | - | - | *** weighted mean *** |
| " | 24.10 | 0.20 | (1.4) | - | Richtler et al. (1992) |
| " | 23.92 | 0.20 | 1.32 | 0.14 | Blakeslee & Tonry (1996) |
| NGC 1427 | 23.78 | 0.21 | - | - | Kohle et al. (1996) |
| weighted mean: (n = 7) | 23.80 mag
± 0.18 (scatter) ± 0.07 (m.e.) | ||||
| Virgo Cluster | |||||
| NGC 4374 | 24.12 | 0.3 | (1.4) | - | Ajhar et al. (1994) |
| NGC 4406 | 24.25 | 0.3 | (1.4) | - | Ajhar et al. (1994) |
| NGC 4472 | 23.85 | 0.08 | - | - | *** weighted mean *** |
| " | 23.84 | 0.11 | (1.46) | - | Harris et al. (1991) |
| " | 23.72 | 0.3 | (1.4) | - | Ajhar et al. (1994) |
| " | 23.99 | 0.3 | 1.20 | - | Cohen (1988) |
| NGC 4486 | 23.88 | 0.07 | - | - | *** weighted mean *** |
| " | 23.73 | 0.06 | 1.40 | 0.06 | Whitmore et al. (1995) |
| " | 24.14 | 0.30 | - | - | van den bergh et al. (1985) |
| " | 23.99 | 0.3 | 1.50 | - | Cohen (1988) |
| " | 23.74 | 0.3 | (1.4) | - | Elson & Santiago (1996a) |
| " | 23.99 | 0.3 | 1.57 | - | Bison & Santiago (1996b) |
| " | 24.20 | 0.3 | 1.73 | - | McLaughlin et al. (1994) |
| " | 23.92 | 0.13 | (1.46) | - | Harris et al. (1991) |
| NGC 4552 | 23.70 | 0.3 | (1.4) | - | Ajhar et al. (1994) |
| NGC 4649 | 23.79 | 0.14 | (1.46) | - | Harris et al. (1991) |
| weighted mean: (n=6) | 23.89 mag
± 0.21 (scatter) ± 0.09 (m.e.) | ||||
| m0V | ± |
| ± | Reference | |
| Leo Group | |||||
| NGC 3377/79 | 22.55 | 0.40 mag | (1.2 mag) | - | Harris (1990) |
| NGC 3379 | 22.20 | 0.30 | - | - | Pritchet et al. (1985) |
| Coma Group | |||||
| NGC 4278 | 23.23 | 0.11 | 1.21 | 0.09 | Forbes (1996a) |
| NGC 4494 | 23.05 | 0.13 | 1.09 | 0.11 | Forbes (1996a) |
| " | 23.65 | 0.40 | 1.4 | 0.11 | Fleming et al. (1995) |
| Possible Virgo Cluster | |||||
| NGC 4365 | 24.37 | 0.15 | - | - | *** weighted average *** |
| " | 24.20 | 0.30 | 1.28 | 0.15 | Forbes (1996a) |
| " | 24.29 | 0.18 | (1.46) | - | Harris et al. (1991) |
| " | 24.68 | 0.3 | (1.4) | - | Ajhar et al. (1994) |
| NGC 4636 | 24.18 | 0.20 | - | - | Kissler et al. (1994) |
| NOTES TO TABLES 1 AND 2 | |||||
(a) Values of m0V have been corrected to AV = 0.06 mag for the Virgo Cluster, based on the average for the galaxies in this sample from Burstein & Heiles (1984). The mean for Fornax was negative, so a value of AV = 0.00 mag has been used, as recommended by Burstein & Heiles. | |||||
(b) If no error estimate has been made for m0V, a value of 0.3 is assumed in order to compute the weighted mean. | |||||
(c) Values of | |||||
(d) A value of V - R = 0.5 mag has been used to convert value of MR from Ajhar et al. (1994). | |||||
(e) A value of B - V = 0.8 mag has been used to convert value of MB from Harris et al. (1991), and van den Bergh et al. (1985). | |||||
(f) A value of V - g = -0.15 mag has been used to convert value of Mg from Cohen (1988). | |||||
(g) A ratio of 2/1 for the blue/red clusters has been used to calculate the total values from Elson & Santiago (1996b). | |||||
(h) Alternative estimates of m0V for the Harris et al. (1991) data, based on maximum likelihood techniques, are available in Secker & Harris (1993). | |||||
Part of the observed dispersion is due to measurement uncertainties. Using galaxies with repeat measurements shows that a typical measurement error is 0.16 mag. Another source of uncertainty is the size of the cluster, with some galaxies in the front or back of the cluster. This is especially important for the Virgo cluster due to its large extent. Assuming the Virgo cluster can be modeled as a sphere with 30 radius, and the more compact Fornax cluster with a 10 radius, leads to uncertainties of 0.11 mag (Virgo) and 0.04 mag (Fornax). Subtracting the measurement uncertainty and depth of cluster uncertainty in quadrature (after taking into account the galaxies with multiple measurements) leaves estimates for the intrinsic dispersion of 0.13 mag (Virgo) and 0.11 mag (Fornax). These values compare well with even the best distance estimators (e.g. Cepheids with 0.10 mag dispersion, Jacoby et al. 1992). The intrinsic dispersion may be even smaller if it turns out that red and blue clusters have slightly different values of M0V (see Ashman, Conti, & Zepf 1995 and Elson & Santiago 1996b), requiring a small correction depending on the ratio of red-to-blue clusters.
Using the measured rather than assumed values from
Table 1 and 2 leads to a mean
value of = 1.35 ± 0.05
mag, with a scatter of 0.17 mag (NOTE: error estimates derived
in this review are 1 sigma uncertainty in the mean, taking external
errors into account
when applicable; e.g. values of M0V include
the uncertainty in the Cepheid zeropoint). If
we restrict the sample to the nine cases where error estimates have been
made we find an observed scatter of only 0.10 mag, smaller than the mean
predicted uncertainty of
0.12 mag. It may therefore be best to assume a fixed value of
when estimating
m0V,
since there is little evidence at present for any real scatter in
. The near constancy in
M0V and
explains why reasonably
good distance determinations can be made using just the bright part of
the GCLF
(Hanes & Whittaker 1987,
Whitmore et al. 1996).
It should be noted, however, that spiral galaxies appear to have values
of which are roughly 0.2
mag lower (H96).