


This project represents an investment of ~ 15 person-years in
observations and follow-up interpretation. It studied well-selected
samples of late-type dwarf galaxies in the VC, consisting of a
representative selection of BCDs and a complete sample of dIs. The BCDs
were selected to have HI detections at the redshift range of the VC and
the dIs had to belong to the ImIV or ImV flavors (low surface
brightness = LSB), and have similar restrictions in the total HI
content. The studies were done using CCD imaging in (U)BVRI and
H (at
the galaxy rest frame) and yielded information about the morphology, the
total and localized SF, the history of SF, etc. The observational
results were described in the PhD theses of Almoznino and of Heller, as
well as in the follow-up publications.
(at
the galaxy rest frame) and yielded information about the morphology, the
total and localized SF, the history of SF, etc. The observational
results were described in the PhD theses of Almoznino and of Heller, as
well as in the follow-up publications.
A brief summary of the findings from the WO project follows. The luminosity distribution for the low surface brightness galaxies follows a Sérsic profile with exponents ranging from 1 to 2 (median 1.74 ± 0.86, Heller et al. 2001). In particular, no de Vaucouleurs profiles could be fitted to any galaxy. In most cases exponential, or truncated exponential profiles seem to be the law. This is similar to what Ryden et al. (1999) found for a sample of dEs and is reminiscent of the finding of Gavazzi et al. (2001) that dEs and late-type dwarfs have similar structural properties when studied in the H-band (1.65 µm). We studied the spatial distribution of light in the broad-band images and found that while the HSB dwarfs show a color gradient from the center to the periphery (the center being bluer), this is not detected in the LSB galaxies (Heller et al. 2001).
The distribution of H
emission shows that in LSB DGs the SF takes place
mostly at the edge of a galaxy, and mostly to one side (lopsidedness
property:
Heller et al. 2000).
This is in contrast with the HSB sample (BCDs), where the SF is mostly
central, or is relegated to a small number of HII regions. This fits the
behavior of the broad-band color gradient mentioned above.
The imaging photometry in
H
(Heller et al. 1999)
showed also that the total SF rate (SFR) is modest in both types of
galaxies: 6.5 × 10⁻² Msun / yr
for BCDs and 7 × 10⁻³ Msun / yr
for the dIs. However, compared with large
(i.e., non-dwarf) spirals the specific SFR, that is, the SFR per unit of
blue luminosity is rather high in both cases and is commensurate with
the SFR in the Milky Way. The SFRs distributions for the two populations
overlap and there are dIs with higher SFRs than some BCDs. The
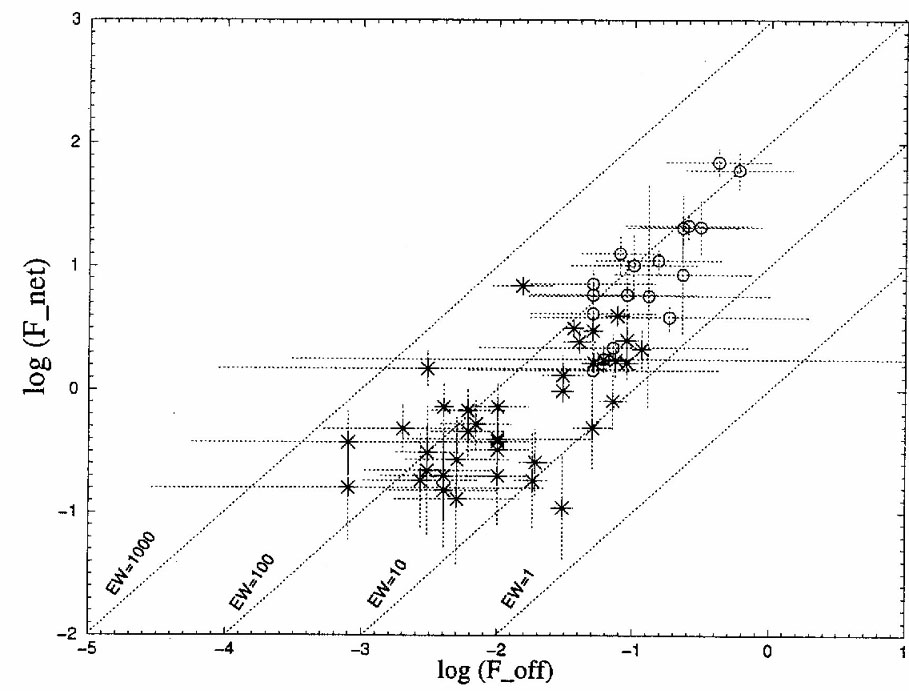
underlying brightness of the red continuum, under the detected HII
regions, correlates with the
H flux from the specific
HII region. This correlation is shown in
Figure 1 and indicates that the triggering of SF
is probably by some local property, such as the local mass of old stars,
or a local, long-lasting concentration of dark matter.
|
Figure 1. Correlation between the
underlying red continuum flux from HII regions and their
H |
In addition, note that we could not identify any VC-related property
that correlated with the SFR. Neither the Virgocentric distance, nor the
radial velocity of a DG, seems to have an influence on the SFRs. We
could not identify immediate neighbors with whom a DG could have
interacted, thus we can rule out prompt tidal interactions as triggers
of SF. This is similar to the findings reported at this workshop by
Yun. The asymmetry and concentration properties of the
H emission can
be reproduced by a random distribution of HII regions
(Heller et al. 2000);
this indicates that probably a variant of the
Gerola et al. (1980)
stochastic star formation scenario may be at work in these LSB dIs. For
HSBs, there is a strong tendency to show a single HII region, or a small
number of HII regions.
We compared our broad-band and
H photometry with
predictions from
different evolutionary stellar populations in order to derive plausible
SF histories for these galaxies. We used models from
Bruzual & Charlot (1993,
1995),
and from
Mas-Hesse & Kunth (1991).
The latter is crucial in understanding galaxies with current star
formation, because the models of Bruzual & Charlot do not deal with
light contributions from hot gas. An example of a diagnostic diagram,
using H, B, and V, is
shown in Figure 2 (from
Heller et al 2002).

|
Figure 2. Diagnostic diagram from Heller et al. (2002). Individual galaxies are plotted as filled triangles and are labeled with their VCC number. The models are plotted as lines and represent a single stellar population (ssp) at different ages and burst populations at different ages and with various metallicities. Lines representing a mix of the two populations connect the ssp model and one of the recent burst models. The fraction of light contributed by the very young population is parameterized as k. |
The figure shows that simple, single-population models cannot satisfy the observations. We found that combinations of two widely different populations, in various proportions, can fit all the diagnostic diagrams. The two populations must have been formed in short bursts, at least the recent one must have low metallicity, and the two bursts must be spaced by at least a few hundreds of Myrs up to a few Gyrs.