


6.3. The nature of the ISOCAM 15 µm galaxies in a CFRS field and in HDF-North
Combining the deep survey on a CFRS field
([Flores et
al. 1999b])
and that on the HDF North
([Aussel et
al. 1999a]),
83 galaxies have been detected at 15 µm, with fluxes in
excess of 250 µJy for the CFRS, and >100 µJy
for the HDF. The positional accuracy of
6" allowed in almost all cases to identify an optical counterpart,
brighter than I(Kron-Cousins)
 23; the mean redshift
is 0.7.
23; the mean redshift
is 0.7.
In the CFRS field, Flores et al. derived the type of the galaxies for which they had enough spectral information, including radio fluxes, by comparing their SED to local templates compiled by Schmitt et al. (1997). They found that more than two thirds of these galaxies are starburst or post-starburst, and that at least at z ~ 0.4 to 0.6, their overall contribution to the global star formation rate is dominant.
Aussel et al., (1999a,
b)
compared the 27 MIR HDF sources with known
redshift to a reference sample of HDF sources from an optical
catalogue. While the redshift distribution of the two samples are
similar, the color distributions are very different. ISOCAM picks
up galaxies with B-I colors corresponding to spirals, and is blind to
the faint blue population responsible for the excess in the B counts
([Ellis1997]).
In summary: it appears that most of the MIR
galaxies have luminosities of the order or brighter than
Lbol
5 × 10¹¹
L (i.e. LIGs but not ULIGs), and are
spiral or merging systems with normal colors, harboring an obscured
starburst or a very well hidden active nucleus.
(i.e. LIGs but not ULIGs), and are
spiral or merging systems with normal colors, harboring an obscured
starburst or a very well hidden active nucleus.
Thanks to the ISOCAM surveys, it has been possible to extend by three orders of magnitude the log N - log S diagram of MIR sources with respect to the IRAS results. Fig. 4, from Elbaz et al. (1999), shows the integral and the differential counts derived from the Lockman Hole and the Marano shallow, deep and ultra-deep surveys performed on guaranteed time (IGTES, PI C.Cesarsky), the two HDF surveys, and an extension to fainter fluxes through the study of a lensed galaxy cluster Altieri et al. (1999). These counts are complemented, at flux > 2 mJy, by the results of ELAIS (PI M. Rowan Robinson; see [Serjeant et al. 2000]). Five independent surveys confirm the breaks of these curves at 400 µJy; in the differential plot, the slope passes from (-1.6) to (-3) for faint sources. On the same figures are shown the expectations from models assuming no evolution, which take into account the infrared bands in the galaxy spectra. Despite the uncertainties in these curves (see discussion in [Elbaz et al. 2000]), there is no question that at least at fluxes below 400 µJy, these source counts imply strong evolution in the population of MIR sources.
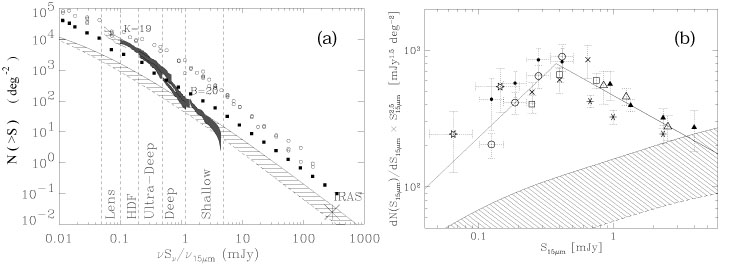 |
Figure 4. (a-left) A summary plot of the integral counts of
ISOCAM 15 µm surveys with 68% confidence contours. K
counts (Gardner et al., 1993) and B counts
(Metcalfe et al., 1995),
multiplied by  /
15µm to
represent the relative
energy densities at high fluxes are overplotted with circles and
filled squares, respectively. The hatched area materializes
expectations from models assuming no evolution and normalized to
the IRAS 12 µm local luminosity function (see
Elbaz et al., 1999 for details). (b-right) Differential number counts of
15 µm galaxies (also from Elbaz et al. 1999). The counts
are normalized to an euclidian distribution of non-evolving
sources which would have a slope of /
15µm to
represent the relative
energy densities at high fluxes are overplotted with circles and
filled squares, respectively. The hatched area materializes
expectations from models assuming no evolution and normalized to
the IRAS 12 µm local luminosity function (see
Elbaz et al., 1999 for details). (b-right) Differential number counts of
15 µm galaxies (also from Elbaz et al. 1999). The counts
are normalized to an euclidian distribution of non-evolving
sources which would have a slope of
 = - 2.5 in such a
universe. The hatched area has the same meaning as in (a). = - 2.5 in such a
universe. The hatched area has the same meaning as in (a). |
The ISOCAM counts also indicate that the sources responsible for them are not ULIRGs with spectra like Arp 220; otherwise, they would produce an infrared background at 140 µm in excess of the value observed by COBE ([Puget et al. 1996]).