


There are two very different aspects to the jet in 3C 273. One is the small scale jet observed with VLBI techniques and showing superluminal motions. The other is the long jet visible at radio, optical and X-ray photon energies from 12" to 22" from the core at a position angle of 222°.
It was already clear at the time of the identification of 3C 273 with an optical object that the radio source had two components called A and B [Hazard MacKey & Shimmins 1963] and that the optical counterpart was coincident with the B component. The optical counterpart had some luminosity in the form of a jet extending in the direction of the A component and ending precisely at its position, [Schmidt 1963]. This established from the earliest time that 3C 273 has a one-sided jet. No counterjet has ever been discovered either at radio or at optical wavelengths.
Modern MERLIN and VLA maps and polarization have been presented in [Conway et al. 1993]. At radio frequencies, the jet flux increases monotonically from the inner radius to a peak located at roughly 21" from the core and then falls steeply. The behaviour is very similar for wavelengths between 2cm and 73cm. The polarization at 6cm is such that the B-field is parallel to the jet axis except at the point of maximum flux (the so called hot spot) where it is perpendicular to the jet axis. At other wavelengths the polarization is qualitatively similar. The maximum polarization is approximately 20% with three spots along the ridge at 14", 17.5" and 20.3" from the core where the level of polarization is very low.
The optical jet is more structured than the radio jet, it is a succession of bright spots and regions of weaker emission. Most modern work on the jet uses a simple denomination for the hot spots given by [Lelièvre et al. 1984]. The spot nearest to the core is labeled A, the subsequent spots are B, C and D. Subsequent work at higher angular resolution then subdivides the spots in sub-units. Figs. 9 and 10 give an optical image of the jet and labels the main spots.
|
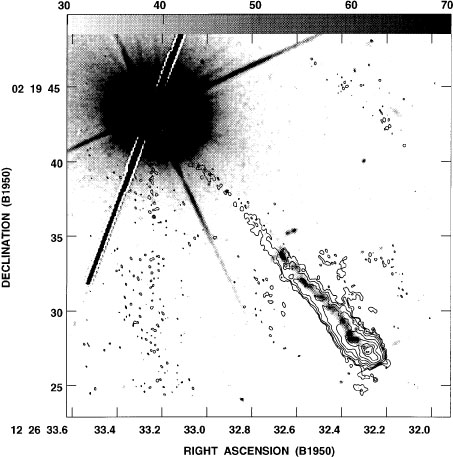
Figure 9. The core and jet of 3C 273 as observed in the radio domain (contours) and with HST (grey scale). This shows that while the radio jet can be followed all the way to the core, the optical jet can only be detected in the outer regions of the jet. This figure is from [Bahcall et al. 1995]. |

|
Figure 10. Same data but showing an enlargement of the jet and the nomenclature of. This figure is from |
Recent optical data on the jet of 3C 273 and a detailed comparison with the radio morphology and polarization of the jet are presented in [Roeser & Meisenheimer 1991], [Roeser et al. 1996a], [Bahcall et al. 1995] and in [Roeser et al. 1997]. It results from these studies that the position angle of the jet as observed in the radio and optical domains is the same at 222.2°. The general appearance of the jet in the 2 spectral domains is similar at first sight. There are, however, some notable differences. The radio jet can be followed from the core of the quasar to the brightest regions, whereas the optical jet can only be observed from some distance to the core onward. This statement is, however, clearly of limited value as it results from systematic observation limitations in detecting weak surface brightness features close to a bright point source. It is nonetheless clear that the ratio of optical to radio flux changes with distance to the core. The high resolution of the HST images reveal that the optical jet is structured on smaller scales than the radio jet and that it is narrower. The optical images show two "extensions" outside the jet axis at the inner and outer edges. At least the outer extension seems to be due to the presence of a spiral galaxy on the line of sight [Roeser et al. 1997].
The radio and optical data may be combined to obtain spectral energy distributions for the knots of the jet.The innermost knot (A) has a straight power law continuum without any sign of a cut-off in the visible or UV, whereas the subsequent knots are well described by a power law extending from 100MHz to 1014Hz followed by an exponential cut-off.
The optical and radio polarization of the jet are also similar in their main properties and also show some discrepancies when looked at in greater details. The maximum polarization is in both cases of the order of 10%, low in the inner regions (< 15") and rising towards the hot spot.
Spectral energy distributions and the relatively high degree of polarization both suggest that the jet emission is due to synchrotron processes. Synchrotron cooling of electrons depends on the inverse square root of the frequency. Optically emitting electrons are therefore expected to be associated with the recent history of the electron acceleration, while radio emitting electrons remember a history thousand times longer. It is thus not necessarily expected that the radio and optical jets should be similar in the location of the hot spots. It should be noted, however, that the presence of bulk relativistic motions would tend to enhance for any observer the emission of those parts of a jet that move in directions close to the line of sight. Such relativistic effects are independent of the frequency and would lead to the presence of coincident bright spots in both the radio and optical images. [Bahcall et al. 1995] suggest one model along these lines in which the jet structure would be due to a helical bulk motion of the emitting electrons within the jet.
Radio profiles of the jet perpendicular to the jet axis [Roeser et al. 1996a] show that the jet is symmetric at large distances from the core, whereas it is more extended in the South closer to the core (at 15"). This extension is not observed in the optical domain and has a steep spectral index. It is suggested that this is emission from material that has passed through the terminal shock and flows backwards along the jet.
Extended X-ray emission in the vicinity of 3C 273 has been detected with the EINSTEIN satellite [Willingale 1981]. It was found that there is an excess emission in the approximate direction of the jet at distances from the core of the quasar that are compatible with the position of the radio and optical jet. The main difficulty associated with these data is that the angular distance of the X-ray excess falls well within the EINSTEIN point spread function. The data were re-analysed by [Harris & Stern 1987] who deduced a position for the centroid of the excess at 16". At this position and with the flux they deduced it was difficult to interpret the origin of the X-ray flux in terms of synchrotron, inverse Compton or thermal emission.
[Roeser et al. 1996b] report on a long (17.2ksec) ROSAT HRI observation of 3C 273 in 1992 to which another 68.2ksec obtained in very early 1995 were added. These authors used the emission from the core of 3C 273 to center the point spread function every 50s and were thus able to correct for the wobble of the spacecraft. This lead to a point spread function of 4.5". Two extended features can be observed in the resulting X-ray image. One is at position angle 71° and is assumed to be from a weak X-ray source not associated with 3C 273 while the other is at position angle 219.3°, close to that observed in the other wave bands. The main contribution comes from a distance to the core of 15", similar to what had been obtained with EINSTEIN. The flux derived from the ROSAT observation is, however, considerably less than that derived from the EINSTEIN data.
It was noted above that the A knot is very blue and showed no evidence of a cutoff at high frequencies. Should the X-ray emission be indeed associated with this knot, then the flux would lie on the extrapolation of the radio-optical spectral energy distribution. The position of the X-ray excess is, however, such that it does not coincide with knot A (nor with any of the sub-knots derived at high angular resolution). The next knot (B) has a spectrum that shows a clear cut-off in the optical spectrum and is therefore unlikely to extend to the X-ray domain. The difficulties in the interpretation raised by [Harris & Stern 1987] remain therefore. Were the X-rays due to inverse Compton processes, one would like to understand why this is observed only at this location rather than associated with all the knots.
The extended jet of 3C 273 is still not completely understood. It is also noteworthy that this is the only jet from a quasar from which optical and X-ray emission have been detected to date. Optical emission from the jets of extra-galactic radio sources is a rare phenomenon, it is therefore not surprising that no other quasar jet has been observed at higher frequencies than the radio domain. It will nonetheless make the task of understanding the nature of the extended jet of quasars very difficult.