


The first step in order to study the distribution of HII regions is to deproject the images of the galaxies. For this we need two angles, namely the position angle (PA) - which is the angle between the line of nodes of the projected image and the north, measured towards the east - and the inclination angle (IA) - which is the angle between the line perpendicular to the plane of the galaxy and the line of sight -. An IA of zero degrees corresponds to a galaxy seen face-on.
Two basic groups of methods have been used so far to determine these angles. The first one is based on photometry and images, and the second one on kinematics. The most standard way to use images is to fit ellipses to the outermost isophotes and measure their axial ratio. This method, which is often used in the literature, is well suited for discs which are not warped, and requires photometric images with high signal-to-noise ratio in the outer parts, where the influence of non axisymmetric components like arms and bars is minimum. Several variants have also been proposed: Danver (1942) used a special display table to rotate the galaxy images until they were circular. Grosbøl (1985) applied the one dimensional Fourier transform to the intensity distribution in the outer parts of disc galaxies and adopted the deprojection angles that minimized the bisymmetric Fourier component.
Another classical method uses a two dimensional velocity field of the
galaxy. Assuming that the emission comes from a thin
planar disk, which is in circular motion around the galaxy center, we
can select the deprojection angles that minimize the
departures from such a flow. This method is particularly well adapted
for HI kinematics, which covers the whole galaxy disk.
During the last decade, however, this method has been applied also to
data coming from CO and H kinematics, which are
generally more restricted to the central parts. This method is specially
well suited for measuring the PA. In the case of warps,
a tilted ring model can be used, but the values of the deprojection
angles will not be uniquely defined, as they will change with
galactocentric radius.
kinematics, which are
generally more restricted to the central parts. This method is specially
well suited for measuring the PA. In the case of warps,
a tilted ring model can be used, but the values of the deprojection
angles will not be uniquely defined, as they will change with
galactocentric radius.
Searching in the literature, we can also find other kind of methods to
derive the deprojection angles that do not use the
techniques described above. Comte et al.
(1979) used a
plot of the HII region distribution of M 101 in a log(r) -
 plane to fit a
straight line to the arms, using the hypothesis that the arms are well
described by logarithmic spirals. Iye et al.
(1982) applied
the two dimensional Fourier analysis to the galaxy NGC 4254, using a
photometric image, and chose the deprojection angles
that maximize the axisymmetric component. Considère &
Athanassoula
(1982) also
applied Fourier analysis but used instead
published catalogs of HII regions. The criterion that they used was to maximize the signal to noise ratio in the m = 2
component. This same criterion was used by Considère &
Athanassoula
(1988)
but using instead photometric galactic images.
plane to fit a
straight line to the arms, using the hypothesis that the arms are well
described by logarithmic spirals. Iye et al.
(1982) applied
the two dimensional Fourier analysis to the galaxy NGC 4254, using a
photometric image, and chose the deprojection angles
that maximize the axisymmetric component. Considère &
Athanassoula
(1982) also
applied Fourier analysis but used instead
published catalogs of HII regions. The criterion that they used was to maximize the signal to noise ratio in the m = 2
component. This same criterion was used by Considère &
Athanassoula
(1988)
but using instead photometric galactic images.
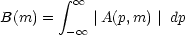
In this paper we will use two methods, which were already introduced by GGA (1991). For our first method we use two dimensional Fourier analysis of the galaxy image. We decompose the HII region distribution in its spiral components using a basis formed of logarithmic spirals. Since the deprojected galaxy should be more axisymmetric than the projected one, we can calculate the deprojection angles are as the angles that maximize the ratio:

| (1) |
where the B(m), m = 0, ..., N are defined as:
| (2) |
and the function A(p, m) is the Fourier transform of the HII
region distribution, considered as a two dimensional
distribution of  -functions
of the same weight:
-functions
of the same weight:
| (3) |
In the above (rj,
j) are the
polar coordinates of each HII region on the galaxy plane,
uj = ln rj and N is the total
number
of HII regions. The details of this method are outlined in GGA
(1991). It is clear
that this method will work mainly for
distributions which have a clear signal of all the components of the
spectrum, specially the m = 0 component which
corresponds to the background disk distribution.
Our second method was also described in GGA (1991). This method is specially devised for HII region distributions. If an axially symmetric distribution of points is divided in Ns equal sectors, like cake pieces, and it is sufficiently rich, then we expect to have a roughly equal number of HII regions in each piece, when viewing it from a line of sight perpendicular to the disc. If the same distribution of points is now viewed from a skew angle and we again use sectors, which are of equal surface in the plane perpendicular to the line of sight, then the number of HII regions will not be the same in all sectors. Thus the correct deprojection angles will be those for which the number of points in each sector is roughly the same, or, in other words, when the dispersion around the mean value is minimum.
None of the methods described are free from systematic errors. In fact they all work perfectly well for the theoretical case of a razor thin, axisymmetric disc in circular motion around its center but present more or less important problems for galaxies deviating from this idealized case. When we fit ellipses to the isophotes, the presence of strong bars and/or spiral arms can bias the results, if the isophotes are not sufficiently external. However, Athanassoula and Misiriotis (2002) show that even for very strong bars the isophotes in the outermost part of the disc are sufficiently circular to be used for deprojection. If we use the velocity fields in HI, the external parts of the galaxy may be warped, in which case the deprojection angles will be ill defined. Our methods also can suffer from systematic problems. For instance, in the case of the first method, if the HII region distribution delineates mainly the m = 2 arms and there are only few regions in the background disk, the ratio (1) will not be well defined and the method can find difficulties. Our methods can also find problems in the case of highly irregular distributions, as well as in strongly barred galaxies where many HII regions are concentrated in the bar region. In these cases our methods will erroneously tend to circularize the bar. A similar difficulty appears when many HII regions are located in some galaxy rings. Buta (1995) using his Catalog of Southern Ringed Galaxies showed that rings need not be circular. The outer features have an average intrinsic axis ratio of 0.87 ± 0.14 while the inner features an average of 0.84 ± 0.10. This indicates that some rings must have an oval nature. Our methods, however, will tend to circularize these structures when they dominate the HII region distribution. Thus they will attribute to a face on case an IA of 12.5 degrees if there was an outer ring of axial ratio of 0.87 and of 9.8 degrees if there was an inner ring of axial ratio 0.84. Of course if only part of the HII regions are in the ring component, then the error could be smaller. In such cases, where HII regions delineate the several components, we obtain secondary minima in the results obtained by our methods. It is thus necessary to check if some of these minima give better results than the principal minimum, which can be strongly biased by some of the effects described above.
Thus, instead of relying on a single method in the crucial step of deprojecting the galaxy image, a comparison of the values given by the different methods is in order. In this way we can choose the pair of deprojection angles that suit best a particular galaxy. Our two methods, in conjunction with the literature values, were used in our first sample of HII region distribution of spiral galaxies (GGA, 1991). In this paper we will use this procedure to the HII region catalogs published in the last decade. We should, however keep in mind that our new sample has a high fraction of barred and ringed galaxies, where our two methods may not perform as well as for the galaxies in the GGA (1991) sample (see Fig. 4).