


In this section we compare the different methods used to determine the deprojection angles (PA, IA). Our aim is to see whether any one is inferior or superior to the others. We compared 7 methods, or groups of methods. Our two methods (method 1 and 2) constitute a group each. The values obtained by Danver (1942) form group D, those by Grosbøl (1985) form group G, and the values from the RC3 catalog form group RC3. The sixth group (kinematics, K) includes all the values obtained using information from HI or optical velocity fields. Finally the seventh group (photometry, P) includes all results obtained fitting ellipses to the outer parts of the galaxies. The values in these last two groups do not constitute homogeneous samples, but the methods used by the different authors are very similar. Moreover, the kinematical method is quite reliable, specially for the determination of the PA.
For comparing any two methods we fitted a straight line to all pairs of
values, using a maximum likelihood algorithm which minimizes the
 2 merit function
| (4) |
where  xi2 and yi2 are
the errors for the ith value (Press et al.
1992).
xi2 and yi2 are
the errors for the ith value (Press et al.
1992).
When using our values, we assigned a weight to each catalog of HII regions as follows: If the catalog is very irregular with a small number of HII regions we assigned a weight of 0.1. If the number of HII regions is small but the catalog looked quite regular we assigned a weight of 0.3. If the catalog has a fair number of HII regions, but the distribution has some irregularities, we assigned a weight of 0.6 and, finally, if the catalog looked regular and had a fair number of HII regions we assigned a value of 1.0. We introduced a further weight, this time for the PA values of all the methods, to take into account the fact that for galaxies nearly face on, it is difficult for any of the methods to assign a reliable value of the PA. We thus assigned a low weight to the PA values of nearly face-on galaxies and a weight of 1. for all the rest. The errors were taken as the inverse of the weights, or, in cases with two weights, as the inverse of their product. In all the correlations we discarded the galaxy NGC 5194. For this galaxy, the values determined for the PA and IA using the kinematical information are in clear disagreement with the values determined using any of the other methods. This must be due to the strong interaction with the companion, NGC 5195.
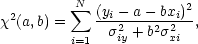
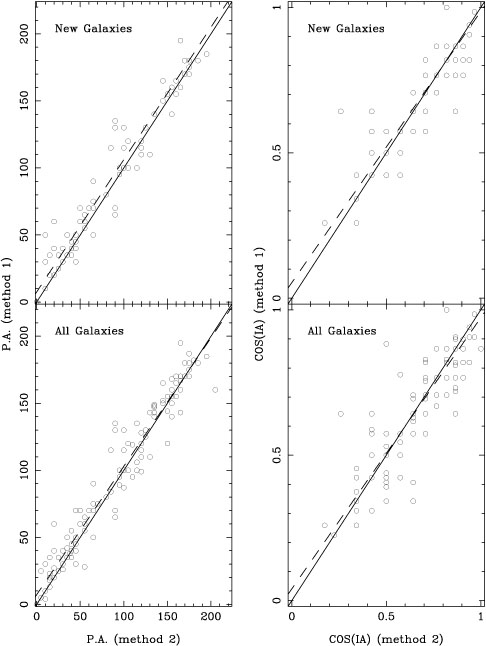
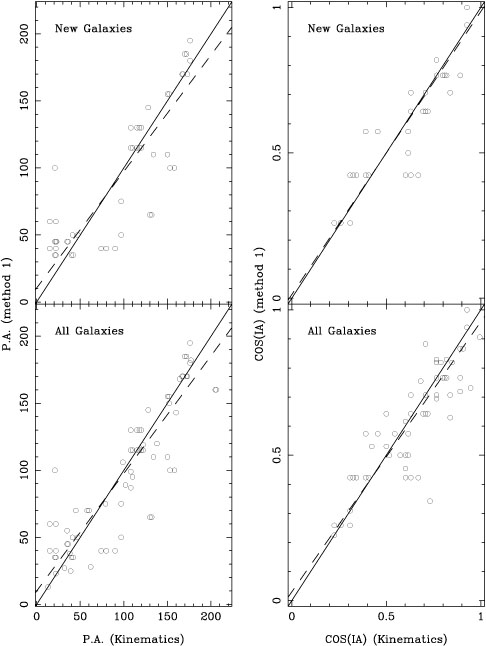
Some illustrative correlations between pairs of methods are shown in Figures 7 to 9. In Fig 7 we compare the results of our two methods, in Fig 8 our first method to the kinematical values and in Fig 9 our first method to the photometrical determined values. To compare quantitatively the results of these and all the remaining correlations (not shown here) we used correlation coefficients as well as the weighted mean of the orthogonal distances of all the points to the best fitting straight line. The results of the comparison are shown in Tables 4 and 5. Tables 6 and 7 give the coefficients a and b of the linear regressions. In all cases the values above and to the right of the main diagonal correspond to the PA, and the values under and to the left of the main diagonal correspond to the cos(IA). We chose the cos, rather than the angle, since the former is uniformly distributed. Note that the values of the orthogonal distances and of the coefficient a for the case of cos(IA) have been rescaled so as to make them directly comparable to the corresponding values of the PA. For the comparisons we pooled together the data of the galaxies of the new sample presented in this paper and the galaxies of the previous sample (GGA, 1991). Obviously a perfect fit between two methods would imply a correlation coefficient of 1, a weighted mean of the orthogonal distances of zero, as well a = 0. and b = 1. Random errors will introduce a scatter, which would lower the correlation coefficient and raise the value of the weighted mean of the orthogonal distances. Systematic differences, as would occur e.g. if a given method systematically overestimated or underestimated the geometric angles, would change the values of the coefficients a and b.
|
Figure 7. Correlations between the values of the PA and IA derived using our two methods. Solid line. Diagonal (perfect correlation). Dashed line. Best fitting weighted linear correlation. |
|
Figure 8. Same as Fig 7 but for the correlations between our first method and the results from HI kinematics. |
|
Figure 9. Same as Fig 7 but for the correlations between our first method and the results from the photometry. |
| 1 st | 2nd | RC3 | G | D | K | P | |
| 1st | 7.1 | 10.5 | 11.3 | 9.6 | 13.3 | 16.5 | |
| 2nd | 7.4 | 9.1 | 8.9 | 6.2 | 11.4 | 14.1 | |
| RC3 | 9.9 | 10.1 | 6.2 | 5.7 | 9.3 | 10.1 | |
| G | 9.2 | 9.0 | 6.1 | 11.6 | 16.0 | 17.8 | |
| D | 13.7 | 11.9 | 5.9 | 12.1 | 9.4 | 20.7 | |
| K | 9.5 | 9.7 | 5.0 | 6.8 | 9.7 | 15.8 | |
| P | 12.9 | 16.2 | 7.7 | 10.1 | 11.3 | 10.9 | |
We note that, although no two methods we have used agree perfectly, there are also no glaring discrepancies. No method seems to overestimate or underestimate either of the deprojection angles. Also no method seems to give systematically smaller correlation coefficients, which would be indicative of a large random error in the results of this method. All correlations range between acceptable and good. The worst correlation coefficient, 0.51, is found when comparing the cos(IA) of Danver and Grosbøl. This, however, is not due to one or several discordant galaxies, but rather to the fact that the galaxies are relatively few and are all clustered at low inclination angles. Nevertheless, the correlation is quite acceptable, as witnessed by the orthogonal distances and the coefficients of the regression line. It could be expected that two methods that rely on similar principles would give results closer to each other than methods based on different principles. We thus found it particularly gratifying to note the good agreement between either of our two methods and the kinematics, which is considered to give very reliable determinations and relies on very different assumptions.
| 1 st | 2nd | RC3 | G | D | K | P | |
| 1st | 0.92 | 0.94 | 0.87 | 0.94 | 0.96 | 0.79 | |
| 2nd | 0.98 | 0.96 | 0.89 | 0.96 | 0.92 | 0.83 | |
| RC3 | 0.87 | 0.88 | 0.96 | 0.98 | 0.88 | 0.89 | |
| G | 0.89 | 0.77 | 0.84 | 0.89 | 0.79 | 0.75 | |
| D | 0.85 | 0.91 | 0.94 | 0.51 | 0.94 | 0.59 | |
| K | 0.98 | 0.85 | 0.93 | 0.86 | 0.89 | 0.81 | |
| P | 0.77 | 0.69 | 0.83 | 0.68 | 0.82 | 0.71 | |
One can thus conclude that all methods are acceptable for statistical analysis of samples of disc galaxies. In particular our two methods are as good as the other methods used so far and can give equally reliable estimates of the deprojection parameters. On the other hand if we are interested in the PA and IA of a particular galaxy it is best to apply several methods. The reason is that the different methods suffer from different biases - i.e. warps in the external parts, non elliptical isophotes or not well defined backgrounds - which might be more or less important in a particular case.
| 1 st | 2nd | RC3 | G | D | K | P | |
| 1st | 7.2 | 12.2 | 5.7 | 8.5 | 9.9 | 5.2 | |
| 2nd | 7.2 | 3.0 | -0.1 | 1.0 | -4.1 | -4.8 | |
| RC3 | -8.8 | -19.0 | 4.1 | -1.4 | -8.2 | 4.5 | |
| G | -3.1 | 9.3 | -19.5 | 14.6 | 1.2 | 15.6 | |
| D | 9.5 | -8.5 | 17.1 | 7.3 | -2.0 | -2.5 | |
| K | 5.3 | -6.9 | 22.4 | -10.2 | 15.5 | -26.5 | |
| P | 8.7 | 4.3 | 13.3 | 29.2 | -12.7 | 7.7 | |
| 1 st | 2nd | RC3 | G | D | K | P | |
| 1st | 0.96 | 0.89 | 0.87 | 0.90 | 0.87 | 0.97 | |
| 2nd | 0.93 | 0.95 | 1.01 | 0.97 | 0.98 | 1.04 | |
| RC3 | 1.02 | 1.12 | 0.94 | 1.01 | 1.03 | 1.01 | |
| G | 0.99 | 0.93 | 1.12 | 0.85 | 1.02 | 0.91 | |
| D | 0.88 | 1.03 | 0.79 | 0.88 | 1.02 | 1.03 | |
| K | 0.93 | 1.04 | 0.81 | 0.91 | 0.92 | 1.30 | |
| P | 0.88 | 0.91 | 0.89 | 0.83 | 1.28 | 0.91 | |
Acknowledgements. In preparing this paper we made extensive use of the CDS Strasbourg database. CGG and CB acknowledge financial support by the Dirección de Investigación cintífica y Técnica under contract PB97-0411.