Copyright © 1999 by Annual Reviews. All rights reserved
| Annu. Rev. Astron. Astrophys. 1999. 37:
487-531 Copyright © 1999 by Annual Reviews. All rights reserved |


Quasars are surprisingly alike in their emission line spectra
(Osmer & Shields
1999
and references therein); for example, the
range of intensity ratios is far less than in galactic nebulae.
Figure 2 shows a composite UV spectrum that
is fairly typical of QSOs without strong BALs. The object-to-object
similarities span the full range of QSO redshifts, 0.1
 z
5, more than 4
orders of magnitude in luminosity, and
billions of years in cosmological look-back time. The emission lines
are either insensitive to the metal abundances, or QSOs have similar
abundances across enormous ranges in other parameters. We argue that
the truth involves a bit of both explanations.
z
5, more than 4
orders of magnitude in luminosity, and
billions of years in cosmological look-back time. The emission lines
are either insensitive to the metal abundances, or QSOs have similar
abundances across enormous ranges in other parameters. We argue that
the truth involves a bit of both explanations.
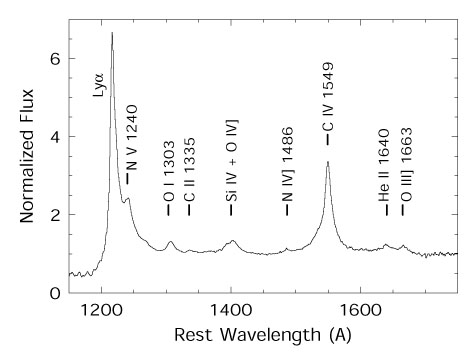 |
Figure 2. Normalized mean spectrum of 13 QSOs at z > 4 (from Shields et al. 1997). Prominent BELs are labeled. |
We focus on the BELs in the rest-frame UV because they are present and relatively easy to measure in all QSOs at all redshifts. Furthermore, unlike the narrow emission lines, there is no ambiguity about their close physical connection to QSO engines (Davidson & Netzer 1979).