


3.4.6. Disk Properties. IV. Vertical Structure
The final subject which I will discuss briefly is the vertical structure of the disk.
The first detailed studies of edge-on galaxies were made by Tsikoudi (1977, 1979, 1980) and by Burstein (1979d). Brightness profiles perpendicular to disks were found to be exponential at intermediate radii, with a rounded region like a Gaussian near the plane (cf. equations 13 and 14). The thickness observed is a combination of the true thickness and projection effects, since the inclination is generally not exactly 90°. At larger heights, the S0s studied had a second, shallower exponential profile, which in NGC 4762 had a scale height of z0 = 1.5 kpc (H0 = 50 km s-1 Mpc-1), and which was valid up to z ~ 6z0. Burstein (1979d) calls this shallow exponential a "thick disk", and suggests that it is a new component in galaxy structure. Such thick disks are illustrated in Figures 1 and 3 of Burstein (1979d). and in Figures 28 and 29, here.
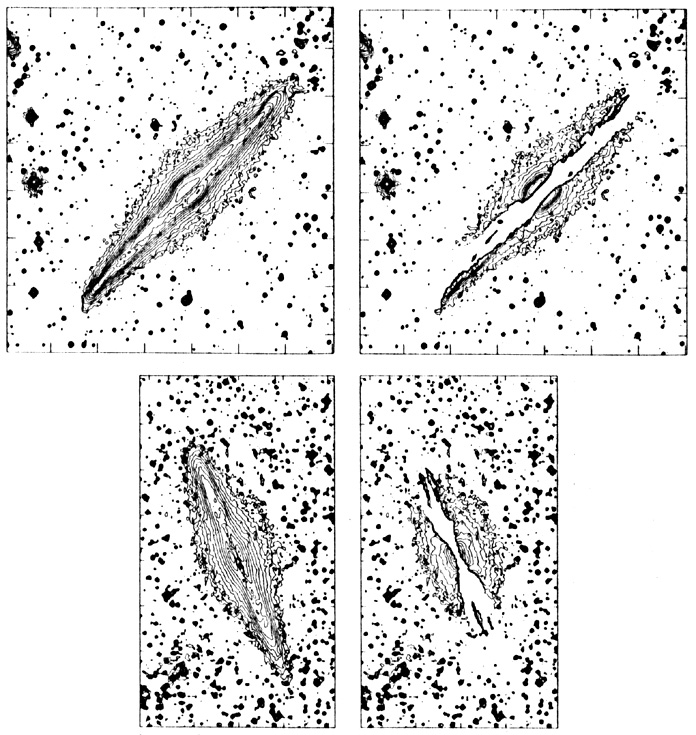 |
Figure 28. (above) Isophote maps of NGC 4565 (upper) and NGC 891 (lower). The right-hand panels show the "bulge" isophotes which remain when the best-fitting disk model (see text) is subtracted from the data. Contours are separated by 0.5 mag arcsec-2; the faintest contour is at 27.5 J mag arcsec-2 for NGC 4565 and 25.1 R mag arcsec-2 for NGC 891. Comparison of the NGC 4565 isophotes with the minor-axis profile of Figure 5 shows that the outer, shallow power law refers to the relatively flattened "thick disk" part of the bulge. |
The question of whether spiral galaxies also have thick disks is
controversial.
Burstein (1979d)
claims that they do not. However,
photometry of edge-on spirals by van der Kruit and Searle
(1981a,
b,
1982a)
and by Jensen and Thuan
(1982)
shows that the perpendicular
profiles have the same shapes as in S0 galaxies
(Fig. 29). In particular,
when a disk profile of the form I(r, z)
 e-r/r0 sech2(z /
z0) is
fitted to the data and then subtracted from the image, there remains a
distribution of stars which is intermediate in flattening between the
disk and the inner bulge (Fig. 28). van der
Kruit and Searle plausibly
argue that the thick disk is just the response at large radii of the
bulge to the flat disk potential (see also
Freeman 1979;
Monet, Richstone and
Schechter 1981).
van der Kruit and Searle have studied
seven galaxies; the four which have bulges also have thick disks
(NGC 891, 4013, 4217, 4565), the others do not (NGC 4244, 5023, 5907).
e-r/r0 sech2(z /
z0) is
fitted to the data and then subtracted from the image, there remains a
distribution of stars which is intermediate in flattening between the
disk and the inner bulge (Fig. 28). van der
Kruit and Searle plausibly
argue that the thick disk is just the response at large radii of the
bulge to the flat disk potential (see also
Freeman 1979;
Monet, Richstone and
Schechter 1981).
van der Kruit and Searle have studied
seven galaxies; the four which have bulges also have thick disks
(NGC 891, 4013, 4217, 4565), the others do not (NGC 4244, 5023, 5907).
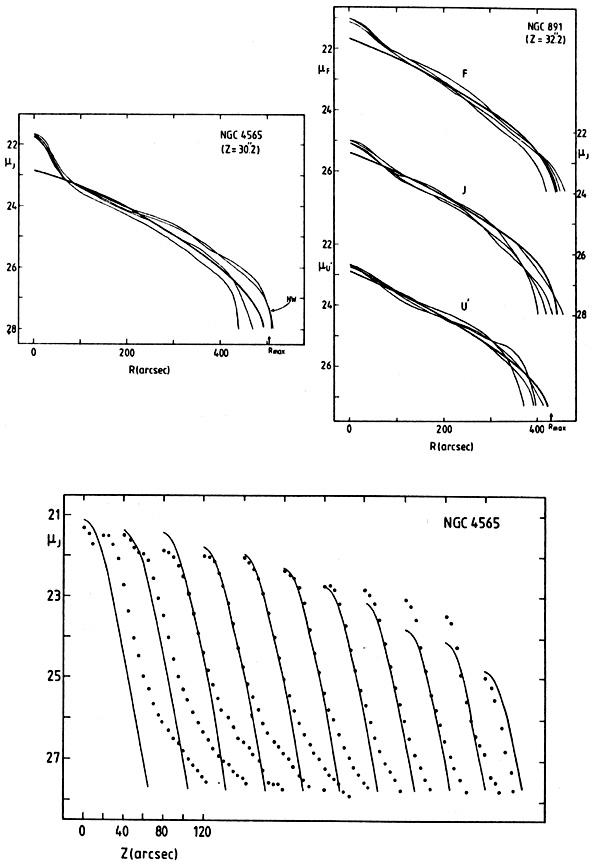 |
Figure 29. (opposite) Brightness profiles parallel to the disks of NGC 891 and 4565 at the height z indicated (top panels). The four thin curves refer to the four quadrants of the image; the thick line is the disk model, truncated at radius Rmax. (opposite, bottom) Brightness profiles (dots) perpendicular to the disk of NGC 4565 at various radii along the disk. The curves represent the best-fitting disk model. This fails near the center because of the bulge. The departure above the model of the data at large r represents the thick disk. Figures 28 and 29 are taken from van der Kruit and Searle (1981a, b). |
In both S0 and spiral galaxies, the disk scale height
z0 is
independent of radius r. This is a very interesting result. Since the
disk mass density
 0
and therefore the disk restoring force are
decreasing rapidly with radius, the scale height z0 =
[
0
and therefore the disk restoring force are
decreasing rapidly with radius, the scale height z0 =
[ z2
/ (2
z2
/ (2  G
0)]1/2
(van der Kruit and
Searle 1981a)
can be constant only if the axial
velocity dispersion is also decreasing with radius:
z
e-r / (2r0).
A constant scale height is interpreted by
Gunn (1981)
as being
consistent with the hypothesis that disks grow by the continual infall
of extragalactic gas. The above photometric work, together with
measurements of the H I kinematics, and especially the velocity
dispersions perpendicular to the disk, are important tools for studying
the mass distribution and evolution of galaxies (see
van der Kruit 1981;
van der Kruit and
Shostak 1982).
I do not have space to discuss
this subject, and refer the reader to the above papers.
G
0)]1/2
(van der Kruit and
Searle 1981a)
can be constant only if the axial
velocity dispersion is also decreasing with radius:
z
e-r / (2r0).
A constant scale height is interpreted by
Gunn (1981)
as being
consistent with the hypothesis that disks grow by the continual infall
of extragalactic gas. The above photometric work, together with
measurements of the H I kinematics, and especially the velocity
dispersions perpendicular to the disk, are important tools for studying
the mass distribution and evolution of galaxies (see
van der Kruit 1981;
van der Kruit and
Shostak 1982).
I do not have space to discuss
this subject, and refer the reader to the above papers.
Hamabe et al. (1979a, b, 1980) and Hamabe (1982) have fitted similar three-dimensional models to their photometry of edge-on galaxies. They confirm many of the conclusions of van der Kruit and Searle. However, the rather poor agreement of the z0 values deduced by the above teams for NGC 4244 and 4565 indicate that there are still problems with the photometry and analysis of edge-on galaxies. This important subject deserves further study.