


10.2. Line - Line Correlations
Emission line ratios are the best ionization parameter indicators, and the correlation of line ratios with the continuum luminosity can be used to check the U vs. L dependence.
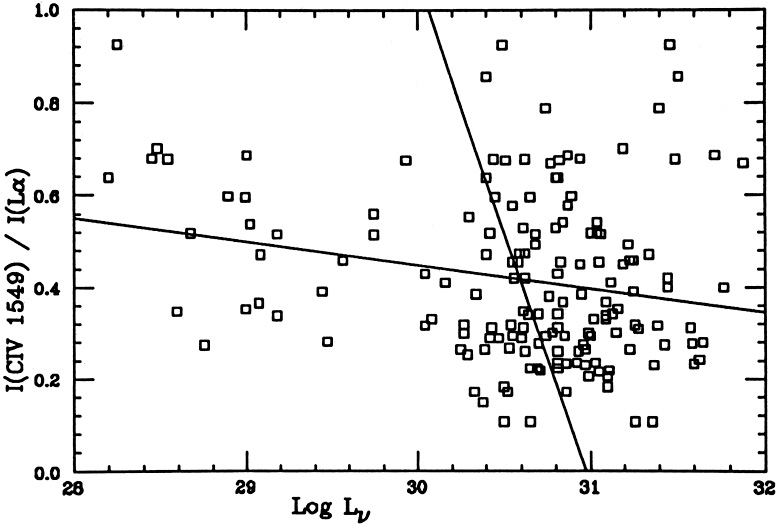
Fig. 29 shows the
CIV 1549 /
L
1549 /
L line ratio, as
a function of the continuum
luminosity, for a sample of 165 AGNs. The scatter in this ratio is
large, but
the tendency is for the line ratio to decrease with increasing continuum
luminosity. This indicates, perhaps, that the ionization parameter in
bright quasars is smaller than in Seyfert 1s
(Fig. 8). Although the correlation
is statistically
significant, it is not clear how representative it is of the AGN
population. The
objects under study were randomly selected from the literature, and
there are
several potential selection effects to be considered. Moreover, despite the
tendency of decreasing
CIV1549 /
L with increasing
luminosity, some bright quasars are definitely exceptional in this
respect.
line ratio, as
a function of the continuum
luminosity, for a sample of 165 AGNs. The scatter in this ratio is
large, but
the tendency is for the line ratio to decrease with increasing continuum
luminosity. This indicates, perhaps, that the ionization parameter in
bright quasars is smaller than in Seyfert 1s
(Fig. 8). Although the correlation
is statistically
significant, it is not clear how representative it is of the AGN
population. The
objects under study were randomly selected from the literature, and
there are
several potential selection effects to be considered. Moreover, despite the
tendency of decreasing
CIV1549 /
L with increasing
luminosity, some bright quasars are definitely exceptional in this
respect.
|
Figure 29.
CIV |
Line ratio diagrams have been constructed for other emission lines, some in
carefully selected samples, where selection effects are not likely to
dominate.
Such well selected samples are rare, and the number of objects in them
rather
small. They cover a limited range in luminosity, and general tendencies
are
hard to discover. Of the more interesting findings we note the increase
of the
CIII]1909 /
CIV1549 line
ratio with L, suggesting, perhaps, a change in U
and/or density with luminosity.