

11.3. LINERs
LINERs are the least luminous and the most common AGNs. At least 30% of
all spirals show this phenomenon and the fraction may even be larger. LINERs
show strong, low excitation emission lines, compared with the high
excitation narrow lines of other AGNs. Their typical
[OII] 3727 /
[OIII]
 5007 line
ratio is about 1, while in Seyfert 1s it is 0.5 or less. The
[OI]
 6300 line
in LINERs
is very strong and lines of [NeV] and [FeVII] are not
observed. There is very
little information about the ultraviolet emission lines in LINERS, a
situation
that is likely to change with the successful operation of the HST. A LINER
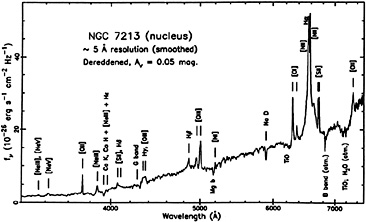
spectrum is shown in Fig. 38.

|
Figure 38. The spectrum of the inner region
of NGC 7213, showing the typical narrow line
spectrum of a LINER and weak broad
H |
Typical emission line widths in LINERs are 200-400 km s-1, smaller than in Seyfert galaxies and comparable to the stellar rotational velocity in the nucleus. The optical, nonstellar continuum luminosity is about 1% of the Seyfert 1 continuum luminosity, i.e. weak compared with the stellar background measured through a typical aperture of a ground-based telescope. There are clear indications, from the emission line spectrum, of ionization by a nonstellar continuum, but no direct observation of this continuum. X-ray emission has been detected in several LINERS but the optical/X-ray flux ratio of the nonstellar source is difficult to measure for the reasons explained above. For similar reasons, it is not yet clear whether the extrapolated ultraviolet continuum is intense enough to explain the observed emission lines. Thus, most of the information on LINERs comes from the analysis of their optical emission lines.
Two types of observations provide the key to the understanding of LINERs.
The first is the detection, in many such objects, of faint, broad
emission wings
to H . This is
demonstrated in Fig. 38 and is known to be
quite common. Thus, a faint broad line region is probably present and
many LINERs are faint, low excitation Seyfert 1 nuclei. Other broad
emission lines are not observed and it remains to be found whether the
broad lines are weak because of extinction, like in the NLXGs,
obscuration or some other reason. The narrow line spectrum of LINERs is
clearly distinguished from that of Seyfert galaxies, in having a much
lower degree of ionization. The way to understand this is by a
comparison of some emission line ratios with those of brighter
AGNs. This is done by ways of constructing diagnostic diagrams, as
explained below.
11.3.1 Diagnostic diagrams. Diagnostic diagrams are constructed from pairs of observed line ratios. They are very useful since different line ratios reveal different information on the ionizing continuum, the ionization parameter, the gas temperature etc. Such diagrams can help to separate blackbody photoionized nebulae from non-thermal photoionized ones and help to identify shock-excited gas. This is crucial for LINERS where the number of well measured emission lines is small, and their intensity is sometimes uncertain due to the presence of stellar absorption features. For example, the so called "Star-burst Galaxies", which are galaxies with giant nuclear HII regions, have often been confused with LINERS and line ratio diagrams can help to separate these groups.
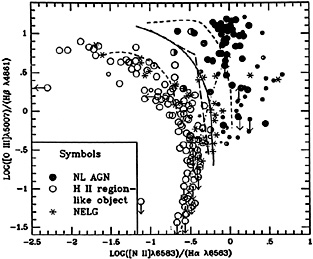
Fig. 39 shows a diagnostic diagram that it is
useful for separating HII
regions, and other nebulae that are ionized by a blackbody continuum, from
AGNs. The diagram compares the
[OIII] 5007 /
H
 line
ratio with the
[NII]
 6563 /
H
 ratio, and is a
good way of measuring the
mean energy of an ionizing photon. This can be used to separate LINERs
from star-burst galaxies. Another useful diagram is
[OIII]
 5007 /
H
 vs. [OII]
 3727 /
[OIII]
 5007. On
this diagram the HII regions are well separated from planetary nebulae, and
from object ionized by a power-law continuum, and all photoionized nebulae
occupy a different region from the shock exINERs to other classes of AGNs.

|
Figure 39. line ratio diagram for different emission line objects. The solid lines separate HII type objects from AGNs and the dashed lines are theoretical line ratios from several photoionization models (after Veilleux and Osterbrock, 1987). |
11.3.2 Shock-wave models for LINERs. The
main motivation for considering shock-wave excitation, is the observation of
[OIII] 4363 in
the spectrum of
some LINERs. This line originates from the 1S0
level of O+2, at 5.3eV above
the ground term. A strong
[OIII]
 4363
indicates a very high kinetic temperature,
40,000 K or so, which is inconsistent with photoionization, given the other
observed lines. Shock-wave excitation is more consistent with such a
temperature.
Shock-wave models applied to LINERs assume cloud motion through an interstellar medium, with velocities of the order of 200 km s-1. The models are not entirely successful and several observed line ratios are not reproduced, despite the freedom exercised in choosing the velocity and density of the gas. The situation is not entirely clear since there are not enough constrains on such models. Future measurements of ultraviolet lines in LINERS will help to clarify the situation.
There are other uncertainties associated with
[OIII] 4363.
First, the
critical de-excitation density of the line is much higher than for
[OIII]
 5007, and
a large
[OIII]
 4363 /
[OIII]
 5007
ratio does not necessarily mean high
temperatures. High (
 106 cm-3) densities could cause a similar
effect. Second, measuring the line intensity is tricky because it falls
in a spectral region full
of stellar absorption features, and the recovery of its intrinsic
intensity is uncertain. The intensity of other emission lines, such as
H
 and
H
and
H , are
also affected by the stellar features.
11.3.3 Photoionization models for LINERs. Photoionization models for LINERs are motivated by the success of such models in explaining the spectrum of more luminous AGNs. The observational situation is, however, very different, since many of the important ultraviolet diagnostic lines have never been observed in LINERs. Another unknown is the shape of LINER ionizing continuum. Other uncertainties include the amount of dust and reddening, obscuration (like in Seyfert 2s) and the contamination of the spectrum by light from nuclear HII regions.
Present photoionization models for LINERs are simple and do not treat the density and covering factor in a very sophisticated way. A power-law ionizing continuum is assumed, with a rather steep slope, to account for the weak observed HeII and other high ionization lines. Despite their limitation, such models are quite successful in explaining many emission lines, and have already revealed an important relation between LINERS and other AGNs.
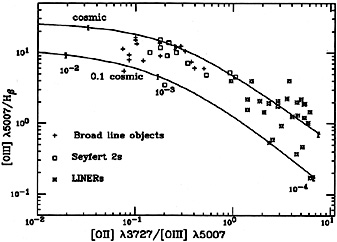
Fig. 40 shows one narrow line diagnostic diagram,
[OIII] 5007 /
H
 vs.
[OII]
 3727 /
[OIII]
 5007, for
a large number of AGNs. Shown also are
calculated line ratios obtained in a simplified, single-cloud
photoionization model,
where the only variable is the ionization parameter. The density in
these models
is constant, 104 cm-3, and the ionizing
spectrum as in Fig. 7. There are
two representative abundances, "cosmic"
(Table 2) and 0.1 cosmic. As evident
from the diagram, all AGNs, from luminous quasars to the faint LINERs, form
a continuous sequence of decreasing ionization parameter. The bright quasars
and Seyfert 1s are at the top of the diagram, with
U
  10-2, Seyfert 2 galaxies
have somewhat smaller U, and LINERs are characterized by U
 10-3.5.
This is a strong indication that LINERs are indeed active galactic
nuclei. In this respect, the narrow emission lines are the most useful
indicators of AGN activity.

|
Figure 40. A line ratio diagram for AGNs. Dereddened narrow line ratios of different types of objects are shown. The continuous curves are the results of two sets of photoionization calculations, with cosmic and 0.1 cosmic abundances. These are single cloud models, with a constant density of 104 cm-3 and variable ionization parameter, as marked. The ionizing spectrum is the standard continuum adopted in this work (Fig. 7). The narrow emission lines of all AGNs seem to form a continuous sequence of decreasing ionization parameter. |
There are several problems in LINERS photoionization models. The narrow
HeII 4686 line
predicted by the models is stronger than observed in many
LINERs (in the particular example discussed here
HeII
 4686 /
H
 0.09),
and other lines are only marginally consistent with the observations. More
realistic models must therefore be computed. More diagnostic diagrams can
help to clarify the situation. They should be compared with the theoretical
calculations and a more detailed investigation of the parameter space
(density, covering factor etc.) must be perform. As for the comparison
with shock-wave
models, some line ratios are very promising in this respect, in
particular lines
of [SII] and [SII] that provide a good distinction between
the two suggested
mechanisms. The few observations of these lines, already obtained, seem to
agree better with photoionization model calculations.
covering factor etc.) must be perform. As for the comparison with shock-wave models, some line ratios are very promising in this respect, in particular lines of [SII] and [SII] that provide a good distinction between the two suggested mechanisms. The few observations of these lines, already obtained, seem to agree better with photoionization model calculations.
11.3.4 Composite models for LINERs and Seyfert galaxies. There have been several attempts to combine shock-wave and photoionization excitation and to explain, in this way, the narrow line spectrum of LINERS and other AGNs. In this picture, the clouds are moving supersonically through the interstellar medium, being illuminated on one side by the central source. The shocked region can be on the illuminated (infall) or the back (outflow) face of the clouds, depending on the direction of motion. There are a large number of free parameters in the model, in particular the relative emission of the photoionized and the shocked gas must be specified. It means that the cloud thickness and the covering factor are inter-related. Such models can, by careful adjustment, produce almost all the observed emission lines. It is unfortunate that the observational limitations do not allow, at this stage, a serious test of this idea.