


3.7. Rate of Cluster Formation Evolution:
The rate of growth of
perturbations is different in universes with different matter content. For
example, the perturbation growth in a
 m = 1
universe is proportional to
the scale factor, ie.,
m = 1
universe is proportional to
the scale factor, ie.,

 (1 +
z)-1, while in the extreme case of an empty universe
(m = 0);
= constant. From (32)
we see that
m < 1
universes will behave dynamically as an
= 1 universe at
large enough
redshift, and at some redshift z ~ 1 curvature dominates and
perturbations stop evolving and freeze, allowing clusters to relax up to
the present epoch much more than in an
m = 1
model, in which
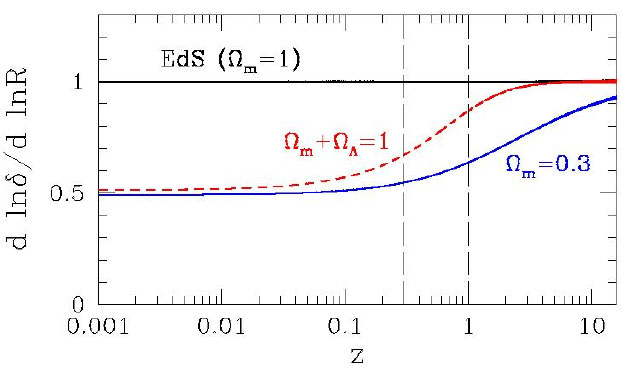
clusters are still forming. This can be seen clearly in
Fig.15 where
we plot the evolution of the perturbation growth factor, defined as:
(1 +
z)-1, while in the extreme case of an empty universe
(m = 0);
= constant. From (32)
we see that
m < 1
universes will behave dynamically as an
= 1 universe at
large enough
redshift, and at some redshift z ~ 1 curvature dominates and
perturbations stop evolving and freeze, allowing clusters to relax up to
the present epoch much more than in an
m = 1
model, in which
clusters are still forming. This can be seen clearly in
Fig.15 where
we plot the evolution of the perturbation growth factor, defined as:

|
For a  = 0 universe,
f
= 0 universe,
f m0.6 (cf.
[115])
and thus for the EdS model f = 1. For
> 0 models
there is a redshift dependence of f, but in
the present epoch it is indistinguishable from the corresponding
value of the open
(m = 1 -
) model
[86].
It is evident that an
0 < < 1 universe
behaves as an
m = 1
model up to a lower
redshift than the corresponding open model, while at redshifts
z
m0.6 (cf.
[115])
and thus for the EdS model f = 1. For
> 0 models
there is a redshift dependence of f, but in
the present epoch it is indistinguishable from the corresponding
value of the open
(m = 1 -
) model
[86].
It is evident that an
0 < < 1 universe
behaves as an
m = 1
model up to a lower
redshift than the corresponding open model, while at redshifts
z  1 it
behaves like an open model, which implies that clusters
should be dynamically older in such a model than in the EdS.
1 it
behaves like an open model, which implies that clusters
should be dynamically older in such a model than in the EdS.
|
Figure 15. The evolution of the
perturbation growth factor, f, in 3 models (EdS, open
|
Therefore one should be able to put constraints on
from the
evolution of various indicators of cluster formation, especially in the
range where the dynamical evolution between the models differs
maximally (vertical dashed lines in Fig.15).
Ideally, one would like to study the evolution of the cluster mass function but since light is what we observe (temperature as well - due to the hot ICM X-ray emission), various related indicators are usually studied (Luminosity function, temperature function, morphology etc), but then one has to pass through the machinery provided by the Press-Schechter formalism [128], which gives the mass function of collapsed halos at any epoch as a function of the cosmological parameters that enter through the assumed power spectrum of perturbations.
Luminosity function: Based mostly on
EINSTEIN and ROSAT
surveys, many studies have found an evolving X-ray luminosity function,
ie., less z  0.3 clusters than expected for a no-evolving luminosity
function, ie., a negative evolution (cf.
[63]
and references therein). Such a behaviour is expected in models with
0.3 clusters than expected for a no-evolving luminosity
function, ie., a negative evolution (cf.
[63]
and references therein). Such a behaviour is expected in models with

|
However, see [69] for a different view.
Temperature function: Estimates of the
temperature of the
X-ray emitting ICM gas can be reliably estimated from the iron
line-emission. Then the cluster temperature can be either transformed to
a mass (assuming hydrostatic equilibrium and isothermality) and thus
derive a mass function to compare with the Press-Schechter predictions
(cf. [133]
and references therein) pointing to
m
< 0.3 , or use
the evolution of the temperature distribution function. Again
different studies find either no evolution (cf.
[56],
[68])
pointing to
|
or evidence for evolution [180], [19] pointing to

|
Evolution of L - T
relation: Under the assumption of
hydrostatic equilibrium and isothermality one can easily show, from
Euler's equation, that the bremsstrahlung radiation temperature is
T
Mv / Rv (where Mv
and Rv are the cluster virial mass and
radius). Using the spherical collapse top-hat model
[114] one obtains
Rv
T1/2
 (z)-1/2
E(z)-1/2, and then by using (56):
(z)-1/2
E(z)-1/2, and then by using (56):
| (92) |
where fg is the gas mass fraction. Then one finds (cf. [31]):
|
where E(z) is given by (18) and
(z) is the
ratio of the average density within the virialized cluster
(
Rv) and the critical density at
redshift z, which also depends on the cosmological model. However,
this model fails to account for observations which show a steeper
T-dependence, Lx
T
3-3.3 (such a dependence can be recovered from
(92) if fg
T1/2). In any case, the L - T relation is
expected to
evolve with time in a model dependent way. Most studies (see
references in
[155])
have found no evolution of the relation while
a recent study of a deep (z ~ 0.85) ROSAT cluster survey
[25] found:

|
However, there are many physical mechanisms that affect this relation (eg. gas cooling, supernova feedback etc) and in ways which are not fully understood (cf. [66]).
Evolution of Cluster Morphology: As we
have already
discussed, in an open or a flat with vacuum-energy contribution universe
it is expected that clusters should appear more relaxed with weak
or no indications of substructure. Instead, in a critical density
model, such systems continue to form even today and should appear
to be dynamically active (cf.
[134],
[59],
[85]).
Using the above
theoretical expectations as a cosmological tool is hampered by two
facts (a) Ambiguity in identifying cluster substructure (due to
projection effects) and (b) Post-merging relaxation time uncertainty
(cf. [150]).
However, criteria of recent merging could be used to
identify the rate of cluster morphology evolution and thus put
constraints on
m. Such
criteria have been born out of numerical simulations (cf.
[139],
[140])
and are based on the use of multiwavelength
data, especially optical and X-ray data but radio as well (cf.
[192],
[154]).
The criteria are based on the fact that gas is collisional
while galaxies are not and therefore during the merger of two
clumps, containing galaxies and gas, we expect: (1) a difference in
the spatial positions of the highest peak in the galaxy and gas
distribution, (2) due to compression, the X-ray emitting gas to
be elongated perpendicularly to the merging direction, and (3)
temperature gradients to develop due to the compression and subsequent
shock heating of the gas. The first two indicators are expected
to decay within ~ 1 Gyr after the merger, while the last may
survive for a considerably longer period (see for example
Fig.16).

|
Figure 16. Optical APM (colour) and ROSAT X-ray (contour) images of 2 ABELL clusters. Peaks of the APM galaxy distribution is shown in blue. A3128 has the signature of a recent merger: the peaks in the distribution of galaxies and in X-ray emitting gas are orthogonal to each other. A2580 on the other side seems a smooth relaxed cluster with the gas and galaxies tracing the cluster potential (from [120]). |
For such a study to be fruitful, a large number of clusters, ideally
covering the redshift range 0.3
x 1, must
be imaged in both the optical and X-ray band.
However, a rather cruder but still useful test of cluster morphological
evolution could be used. For example, cluster ellipticity is a relatively
well defined quantity; although systematic effects due to projections
in the optical or the strong central concentration of the X-ray
emitting gas (since Lx
ne2), should be taken into account (cf.
[81]).
An early study, using the Lick map
[121],
had found that
cluster ellipticity decreases with redshift, however due to possible
systematic effects involved in the construction of the data, they did not
attach any weight to this discovery. Recently, two studies using
optical and/or X-ray data
[100],
[127]
(see also [120])
found that
indeed the cluster ellipticity decreases with redshift in the recent
past, z
0.15 (see
Fig.17)
This was interpreted by
[100]
as an indication of a
low-m
universe because in such a universe one
expects that merging and anisotropic accretion of matter along
filaments will have stopped long ago. Thus the clusters should
be relatively isolated and gravitational relaxation will tend to
isotropize the clusters reducing their ellipticity, more so in the recent
times.
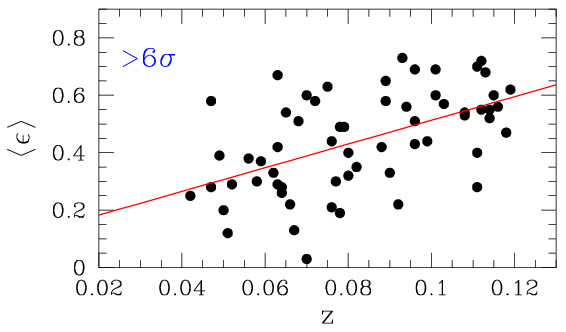
|
Figure 17. The evolution of ellipticity in APM clusters with significant substructure [120]. |
If this is the case then one should expect an evolution of the
temperature of the X-ray emitting gas as well as the X-ray cluster
luminosity which should follow the same trend as the cluster ellipticity,
decreasing at recent times, since the violent merging events, at relatively
higher redshifts, will compress and shock heat the diffuse ICM gas
[138].
Such evidence was presented in
[127]
using a compilation of measured
ICM temperatures and luminosities in two volume limited X-ray
cluster samples (based on the XBAC and BCS samples). Also, one
could naively expect an evolution of the cluster velocity dispersion,
increasing at lower redshifts, since virialization will tend to increase the
cluster ‘thermal' velocity dispersion. In
[65]
no evolution was found between a local sample (z
0.15) and a
distant one 0.15
z 0.9.
However, unrelaxed clusters can also show up as having a high
velocity dispersion due to either possible large peculiar velocities of
the different sub-clumps
[142]
or due to the possible sub-clump
virialized nature. Therefore, a better physical understanding of the
merging history of clusters is necessary in order to be able to
utilize the velocity dispersion measure as an evolution criterion.
Other related studies, using the morphological characteristics of the
large-scale structures, have been used to place cosmological constraints.
For example, the shapes of superclusters and voids, using the IRAS-PSCZ
redshift survey and the ABELL/ACO cluster distribution show a clear
preference for a
-CDM model over a
m = 1
model
[13],
[126],
[82],
[102]
but see [2].