


4.2. Time-delays and Temporal Sampling
With its bright images, its wide angular separation, and with the availability of reference stars within a few arc-minutes, PG 1115+080 is an excellent target for photometric monitoring. Excellent does not automatically imply easy ! Photometric monitoring still requires good seeing, at least a medium size telescope (2m) and a temporal sampling adapted to the observed variations.
Choosing the temporal sampling of the light curves is critical. It is often claimed that it should be smaller than half the expected time-delay, but this is not quite true. The measurement of the time-delay is done through the measurement of the photometric variations of the quasar itself. Therefore, the sampling should be chosen according to the typical time-scale observed or expected in the photometric light curves. In an ideal case where the intrinsic variations of the source are slow compared with the time-delay, one can in principle chose a sampling even larger than the time-delay. The situation is quite the same than in image processing where one can measure the position of an object on a CCD frame with a much higher accuracy than the sampling adopted to represent this signal.
However, while one do not need in principle very high temporal sampling, the situation in practice is just the opposite. First, one does not know in advance what the time-scale of the variations will be: the frequency range in quasar variability spans from days to weeks or even months. Second, even if the variations are slow, their amplitude is small, often of the order of a few tens of a magnitude, sometimes a bit more in the case of Broad Absorption Lines (BAL) quasars. Measuring faint variations is easier with well sampled light curves. Well sampled curved are, in addition, well suited to the use of cross-correlation techniques in order to measure the time-delay. Finally, microlensing by stars in the lensing galaxy introduces flickering of the light curves, with a frequency that is in general unknown and not even easy to predict before the data are actually taken. There is therefore no general line to adopt on the choice of the sampling other than trying to get "the finest possible sampling"!
The case of PG 1115+080 is lucky enough that the photometric
variations of
the source are slow, and well sampled light curves could be obtained
(Schechter et al. 1997;
see Fig. 7). Even with light curve of such a
quality, extracting the time-delay(s) can be tricky.
Schechter et al. (1997)
uses the method devised by
Press et al. (1982)
to compute a global
 2 between shifted
versions of the light curves. They
estimate the time-delay between components C and B to be
2 between shifted
versions of the light curves. They
estimate the time-delay between components C and B to be
 t(CB)
= 23.7 ± 3.4 days and the time-delay between component C and A is
t(CA)
= 9.4 days, where C is always the first one to vary,
i.e., the "leading image". A different approach was chosen by
Barkana (1997)
to analyse the same data. Using an analytical
representation of the light curves and taking into account the
correlations between the errors on the individual photometric
measurements, they derive a very similar time-delay between components
C and B,
t(CB)
= 25+3.3-3.8 but the second time-delay
is significantly longer
t(CA)
= 13 days.
t(CB)
= 23.7 ± 3.4 days and the time-delay between component C and A is
t(CA)
= 9.4 days, where C is always the first one to vary,
i.e., the "leading image". A different approach was chosen by
Barkana (1997)
to analyse the same data. Using an analytical
representation of the light curves and taking into account the
correlations between the errors on the individual photometric
measurements, they derive a very similar time-delay between components
C and B,
t(CB)
= 25+3.3-3.8 but the second time-delay
is significantly longer
t(CA)
= 13 days.
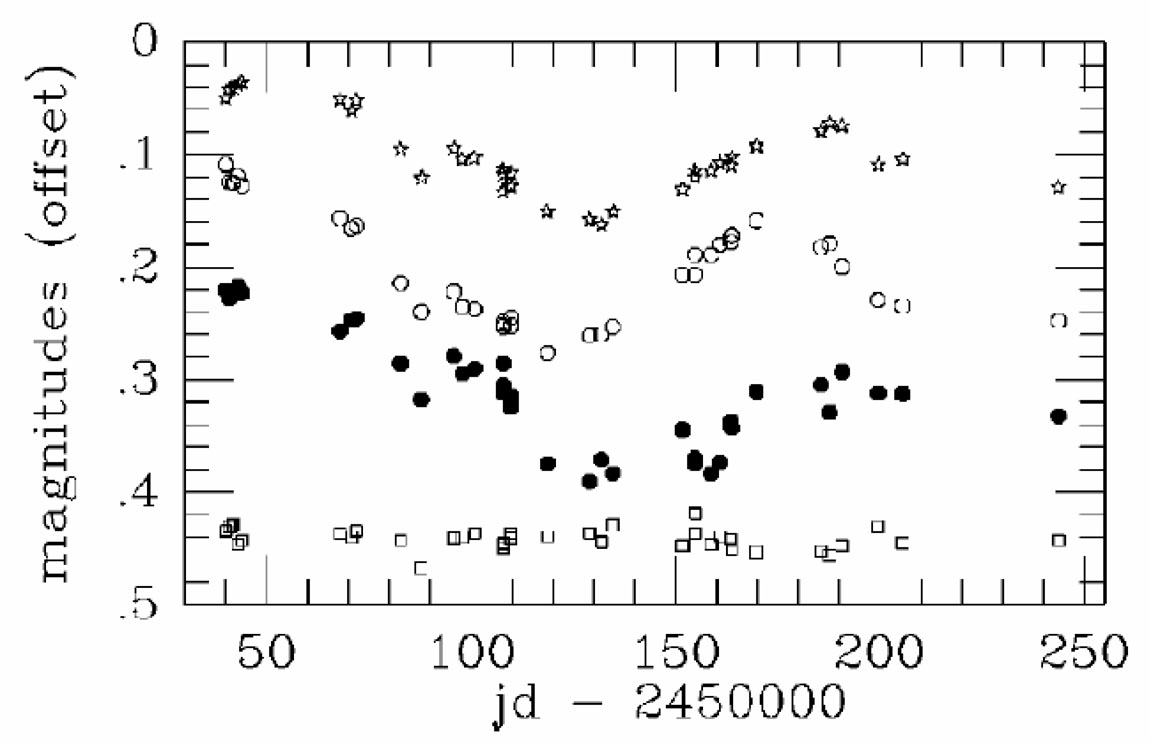 |
Figure 7. Optical V-band light curves for the different components of PG 1115+080. From top to bottom, the curves for the blend A1/A2, component C, component B, and a reference star (Schechter et al. 1997). Note the smooth and slow variation of the quasar, the absence of high frequency flickering, as would introduce microlensing, and the striking similarity between the light curves. |